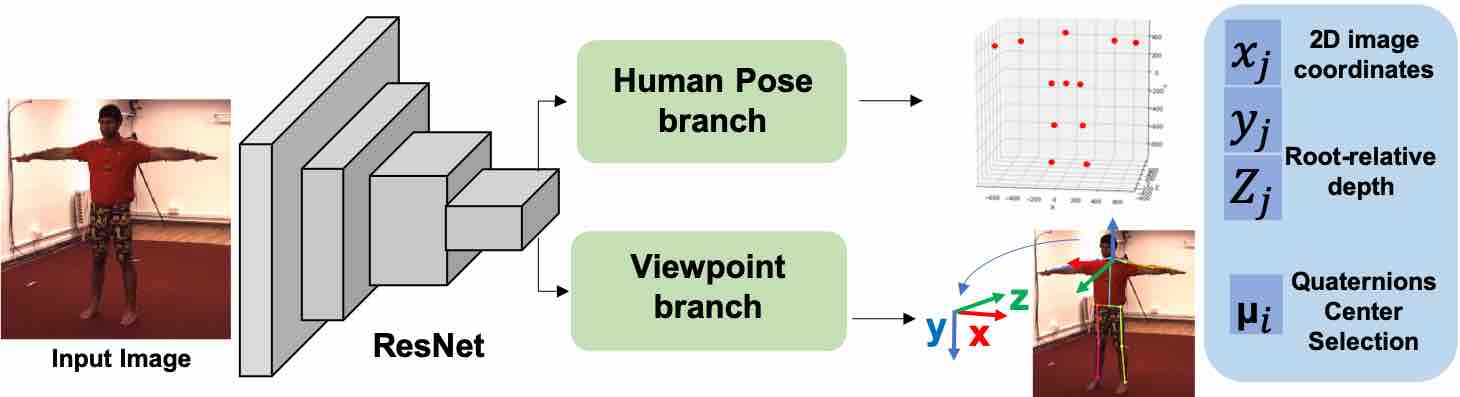
Flowchart of our model. We augment a model which predicts cameracentered 3d pose using the human pose branch with an additional viewpoint
branch that selections among a set of quantized camera view directions.
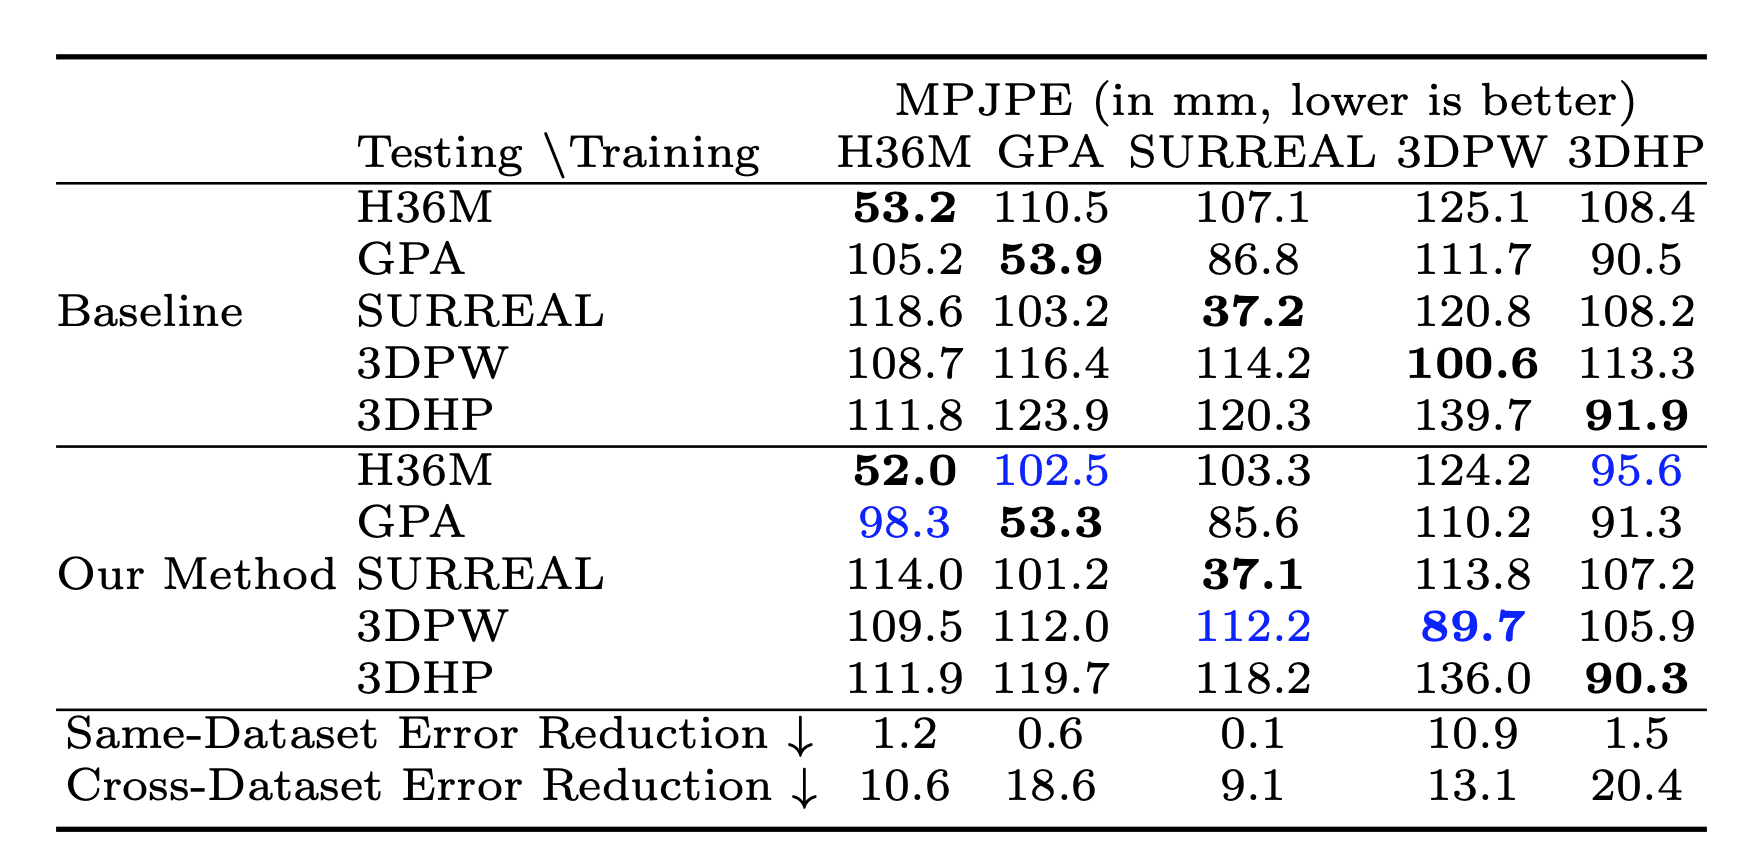
Baseline cross-dataset test error and error reduction from the addition
of our proposed quaternion loss. Bold indicates the best performing model on
each the test set (rows). Blue color indicates test set which saw greatest error
reduction.
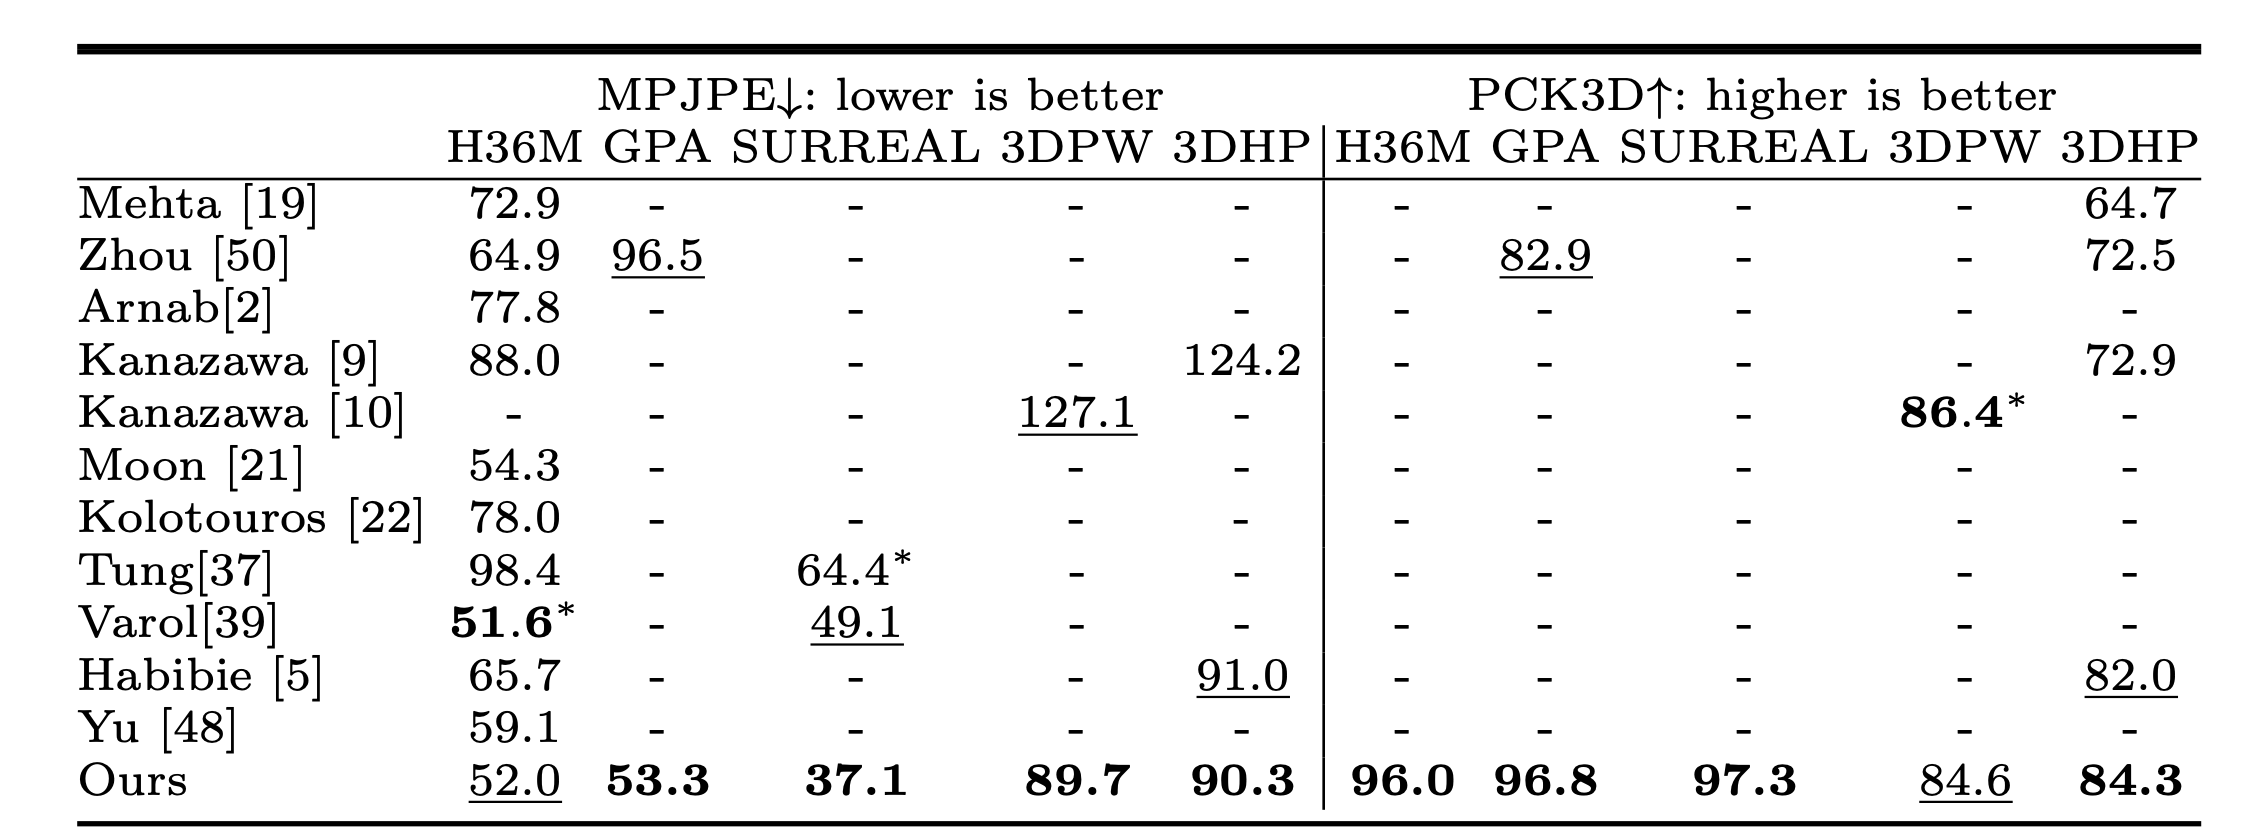
Comparison to
state-of-the-art performance. There are many missing
entries, indicating how infrequent it is to perform multi-dataset evaluation. Our
model provides a new state-of-the art baseline across all 5 datasets and can serve
as a reference for future work. * denotes training using extra data or annotations
(e.g. segmentation). Underline denotes the second best results.
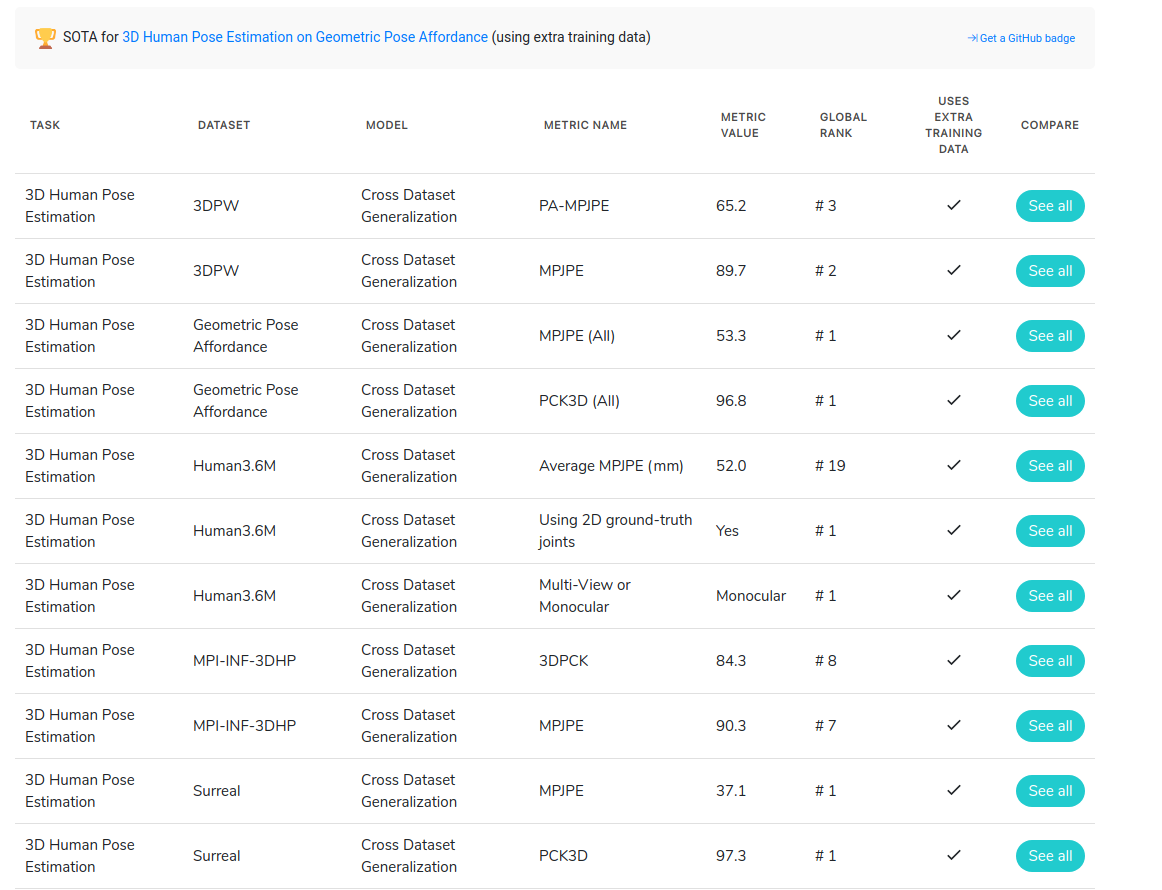
Screenshot of our methods on
Paper-with-code webpage on April 12th, 2020.
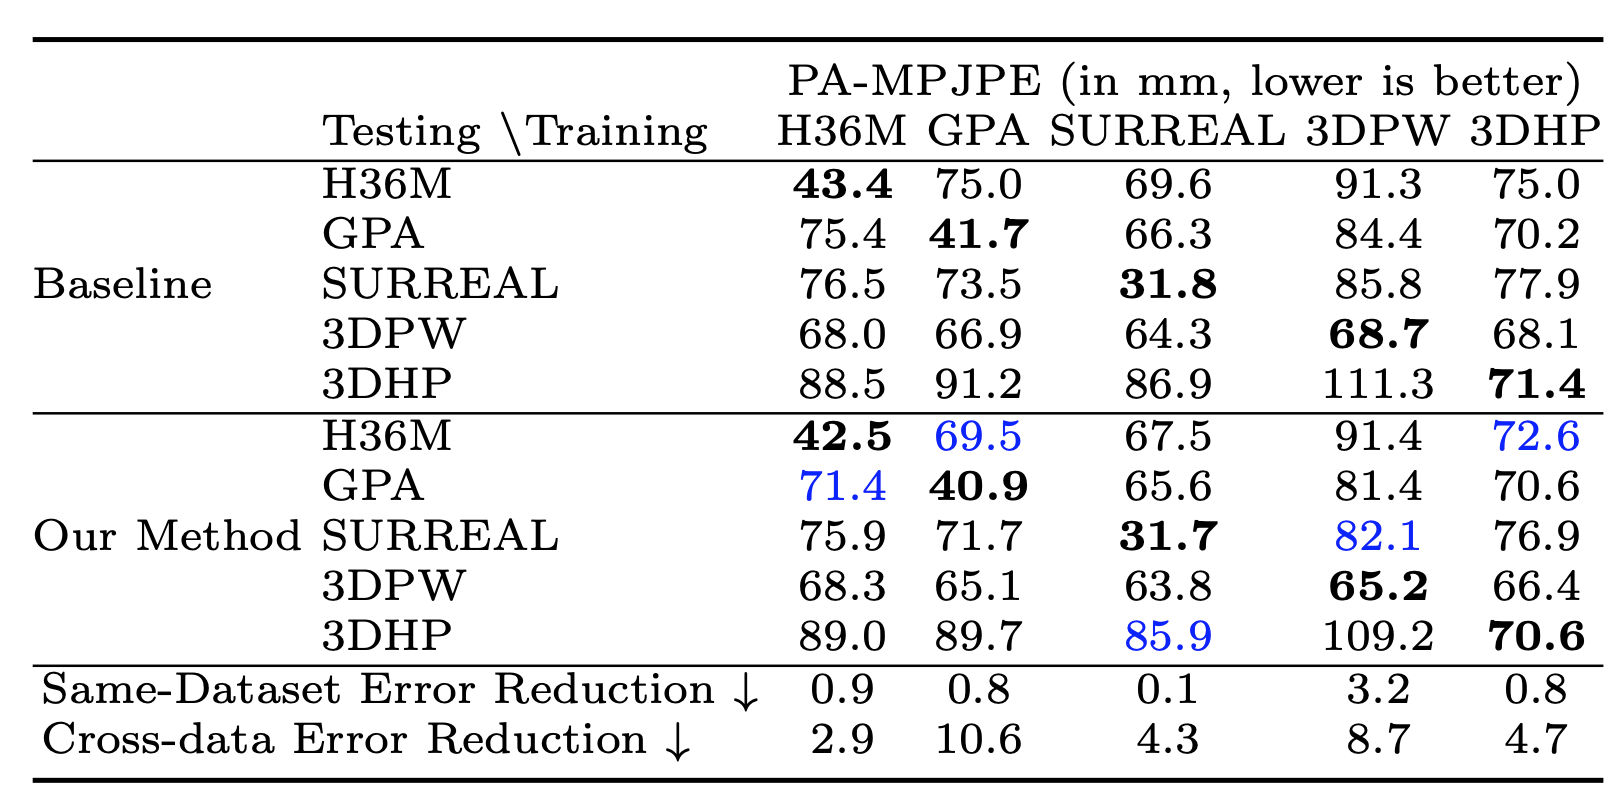
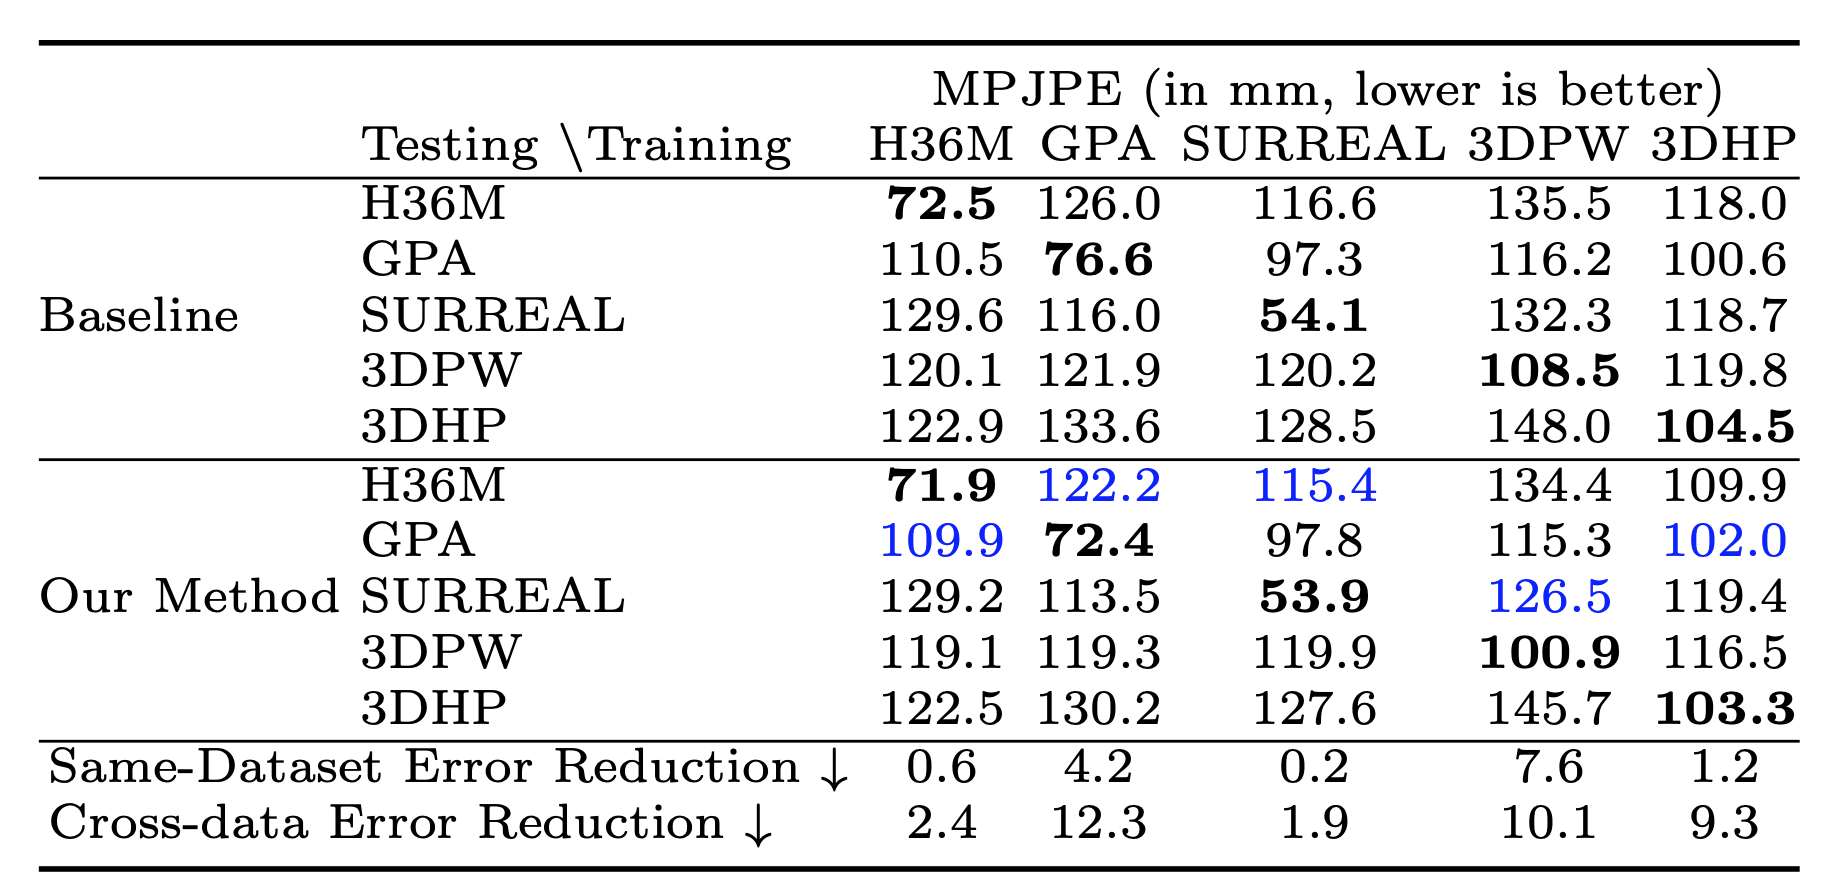
Baseline cross-dataset test error and error reduction (Procrustese aligned
MPJPE) from the addition of our proposed quaternion loss. Bold indicates the
best performing model on each the test sets (rows). Blue color indicates test set
which saw greatest error reduction.
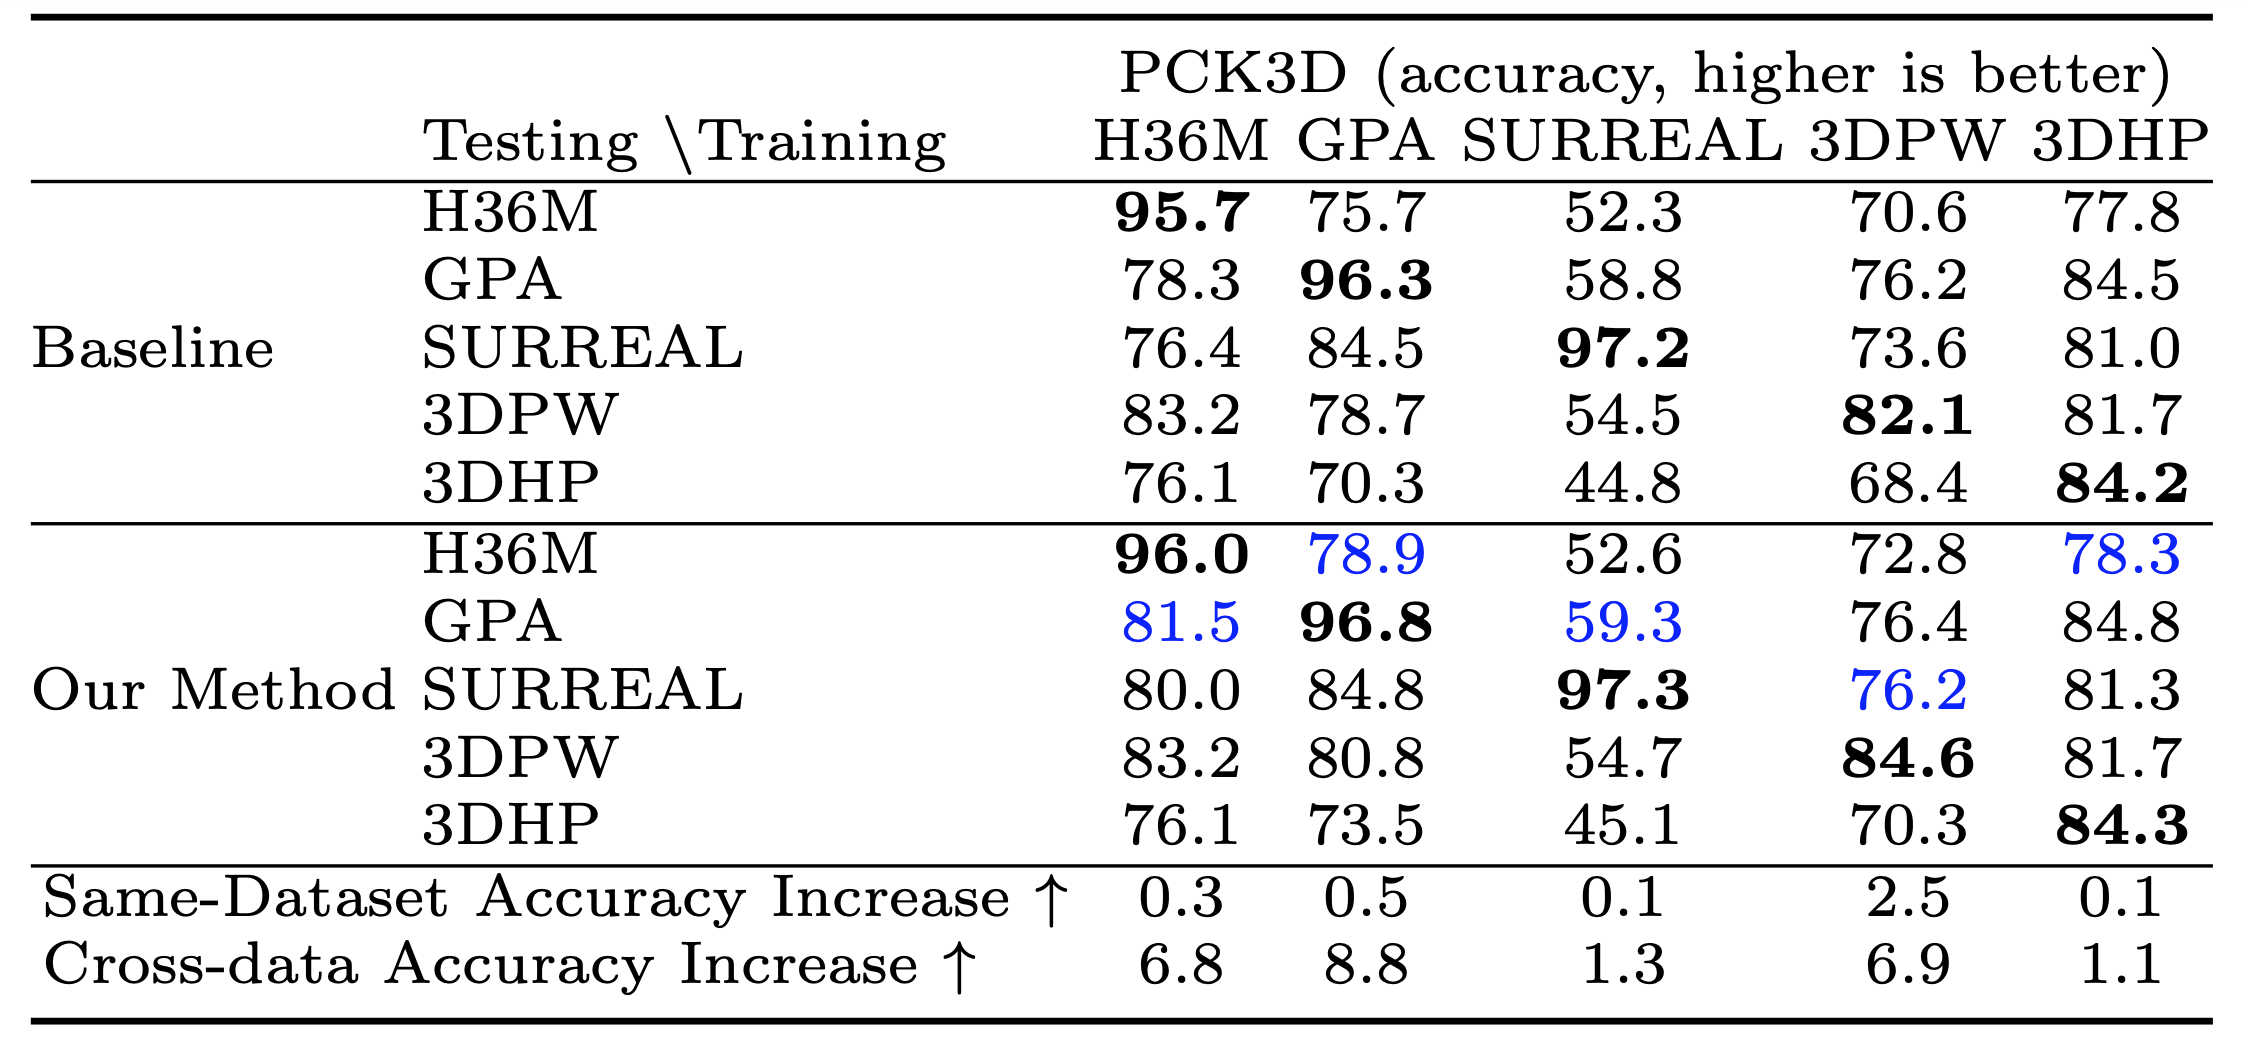
Baseline cross-dataset test accuracy and accuracy increases (PCK3D)
from the addition of our proposed quaternion loss. Bold indicates the best
performing model on each the test set (rows). Blue color indicates test set which
saw greatest accuracy increase.
Retraining the model of Zhou et al. [50] using our viewpoint prediction loss
also shows significant decrease in prediction error, demonstrating the generality
of our finding.
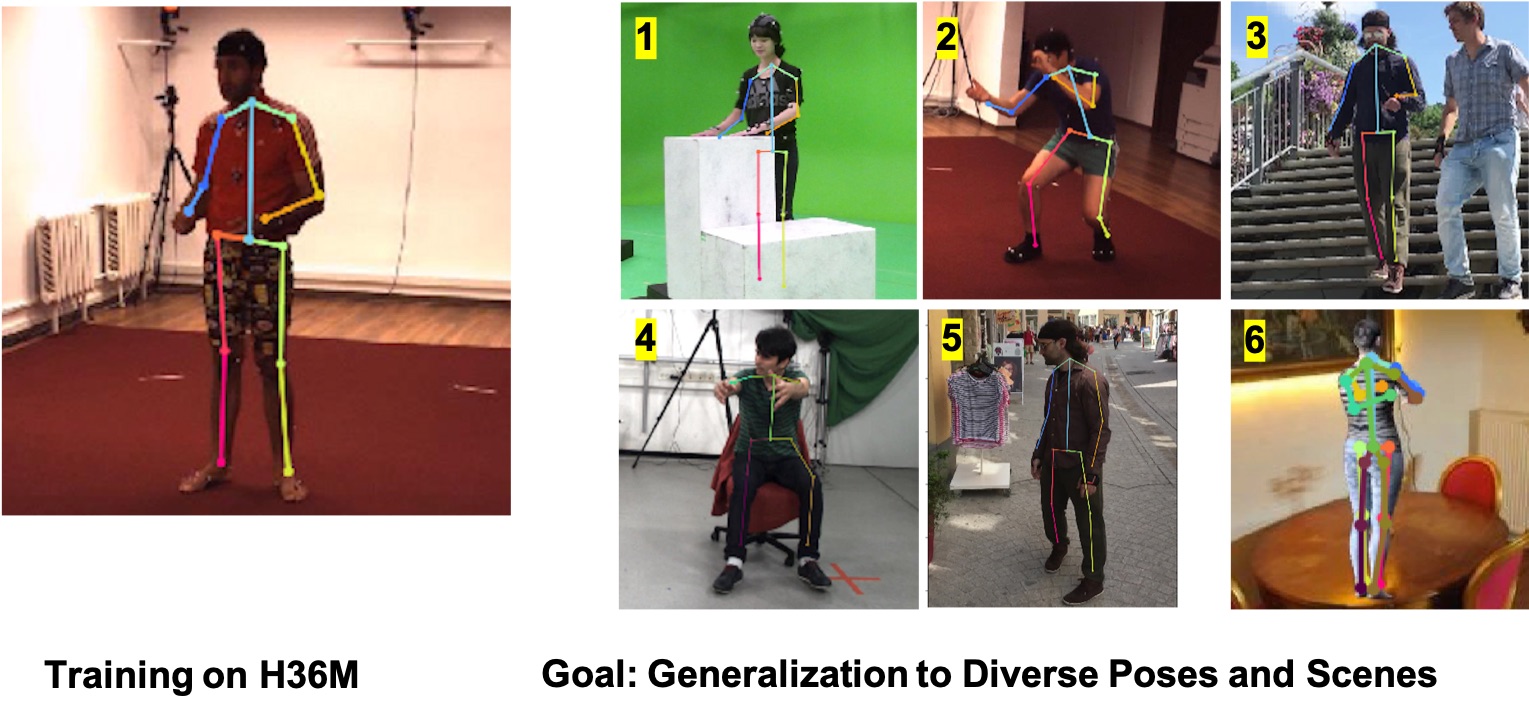
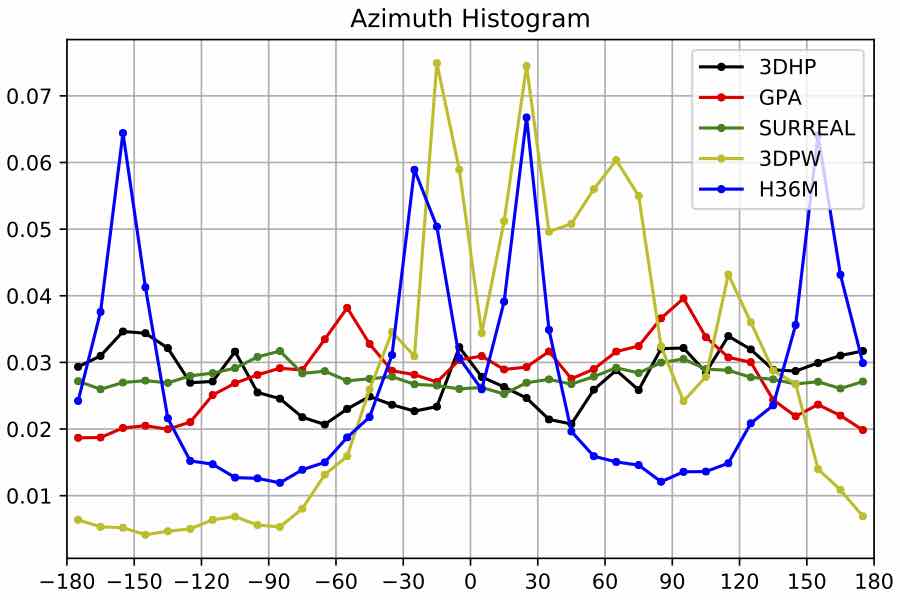
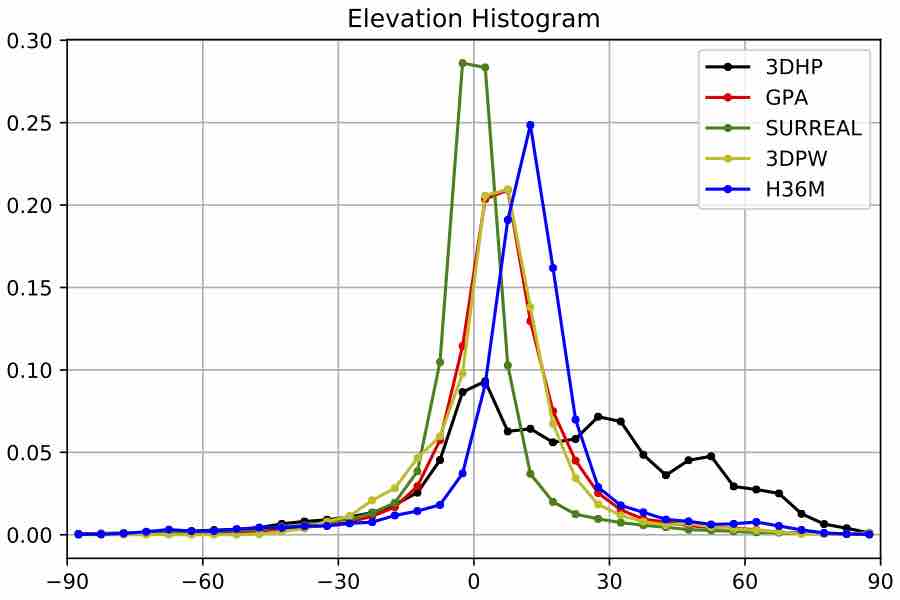
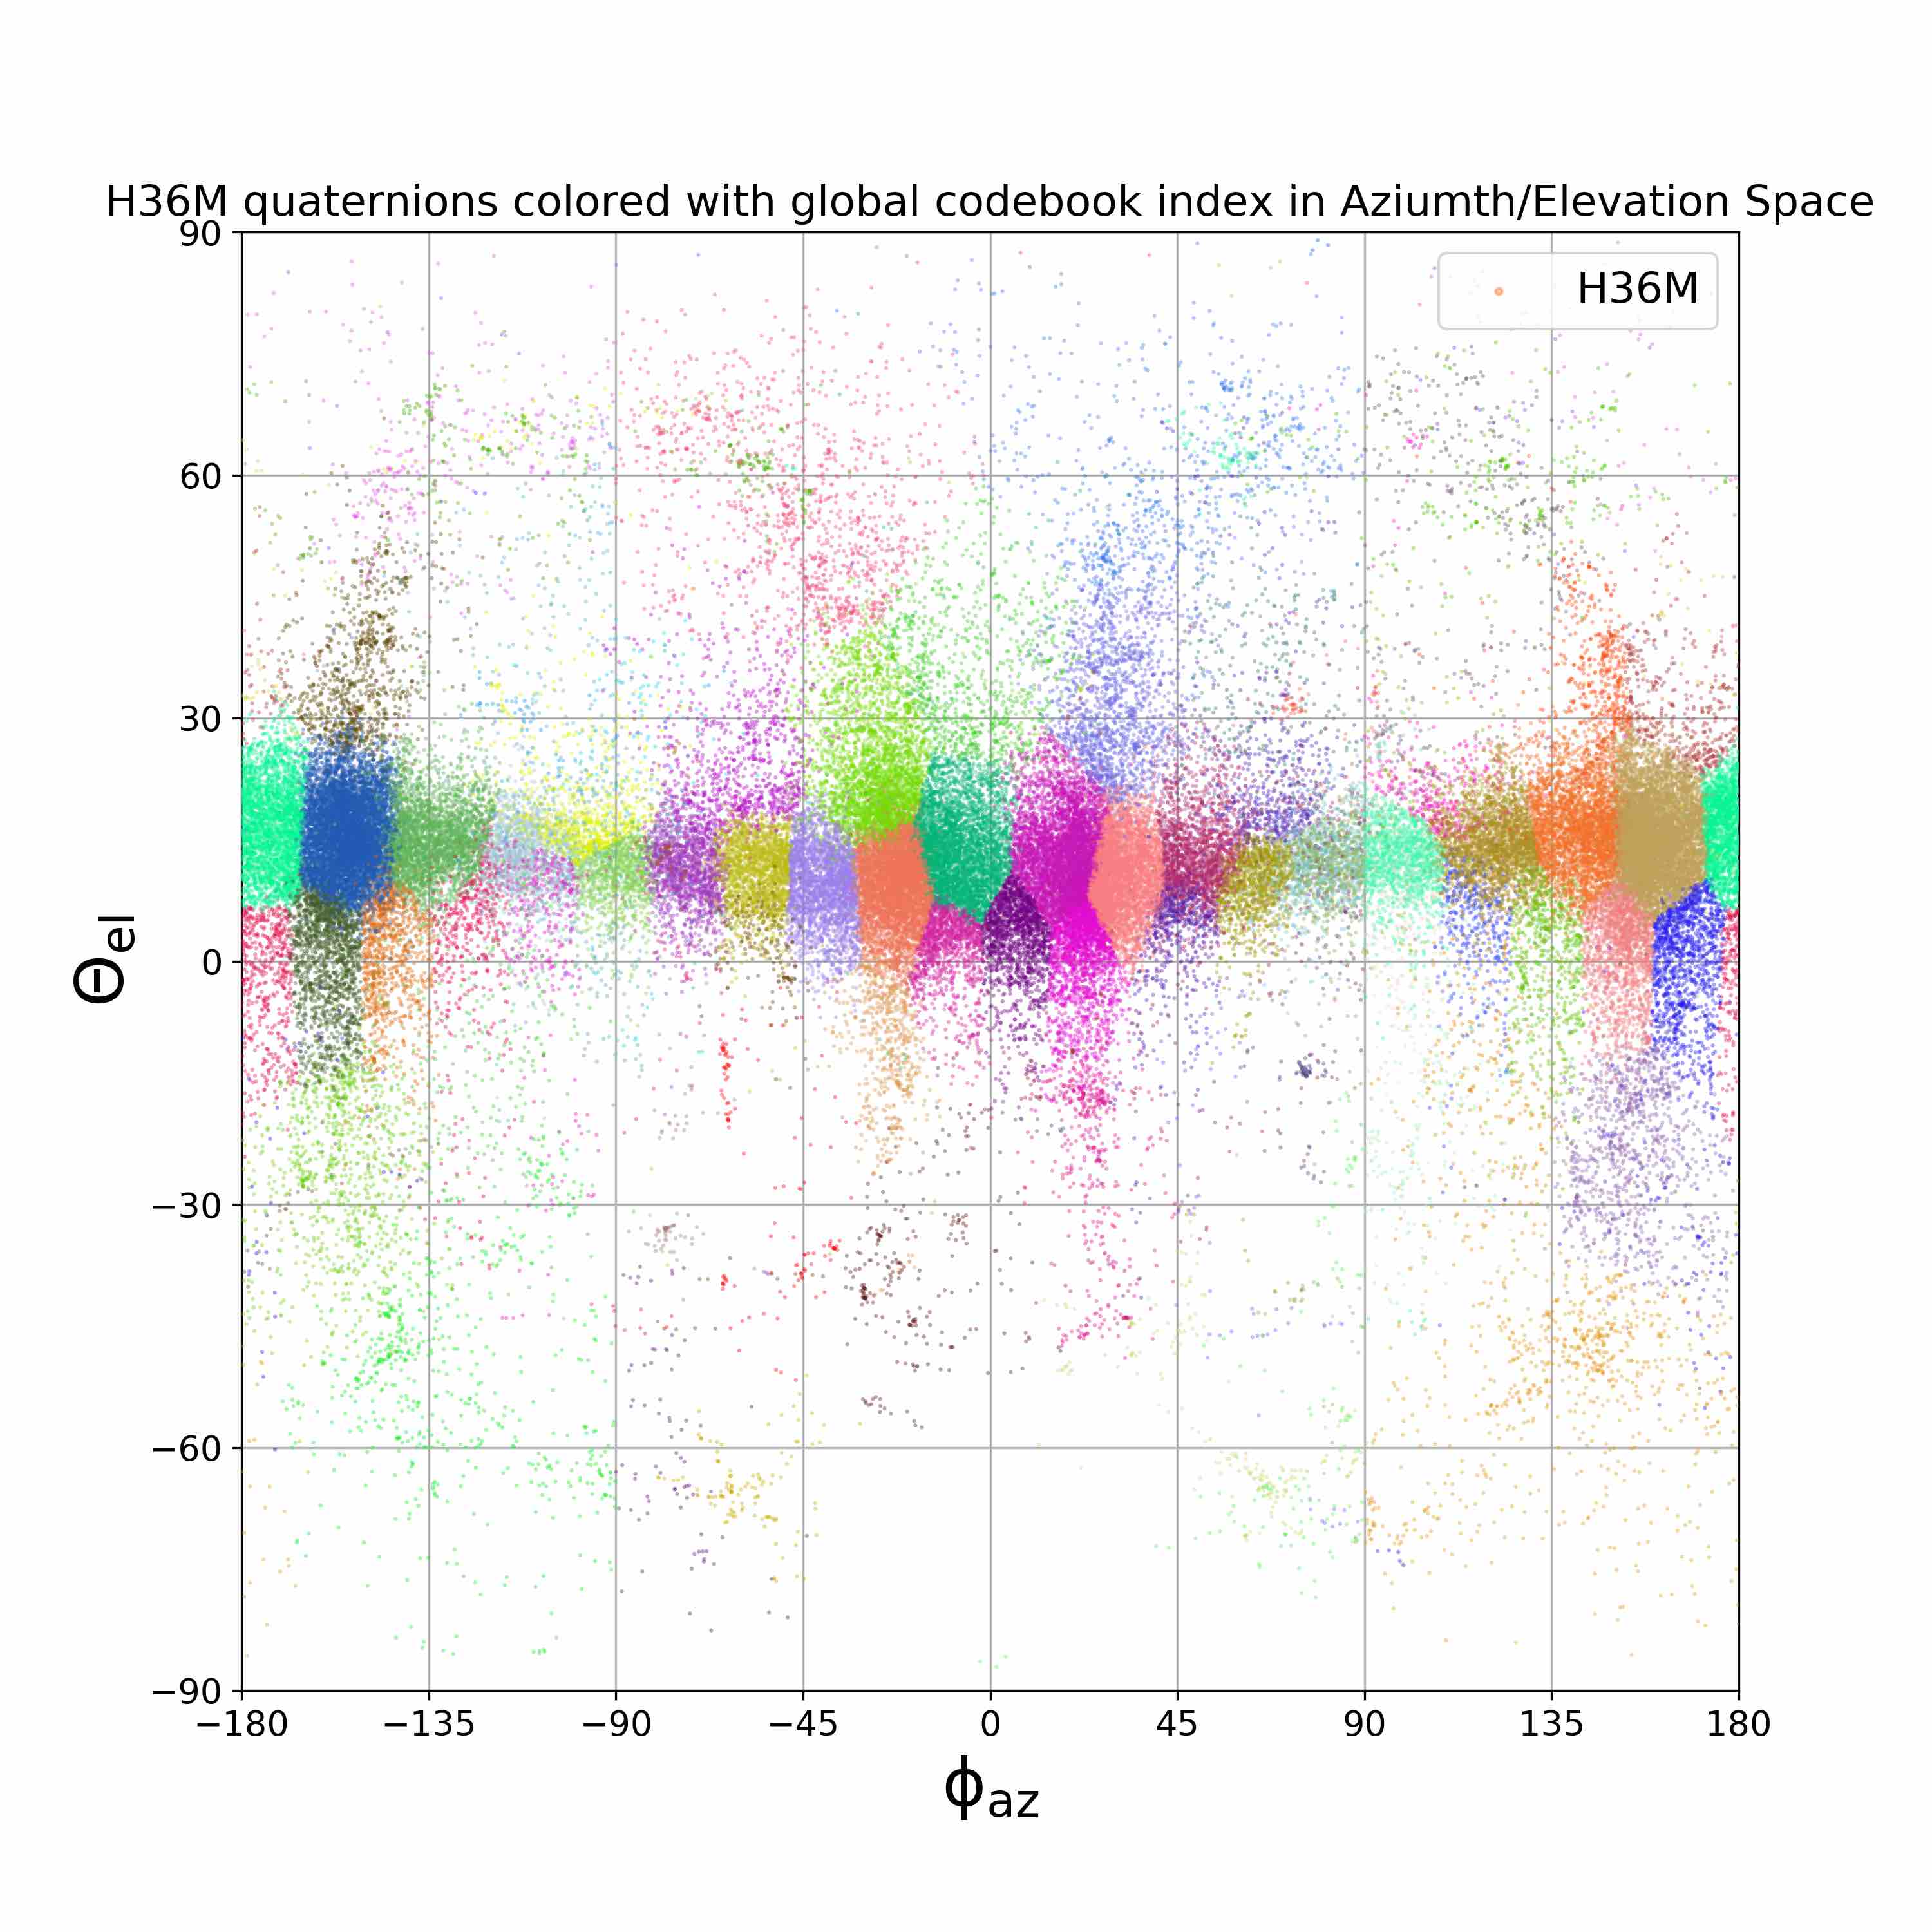
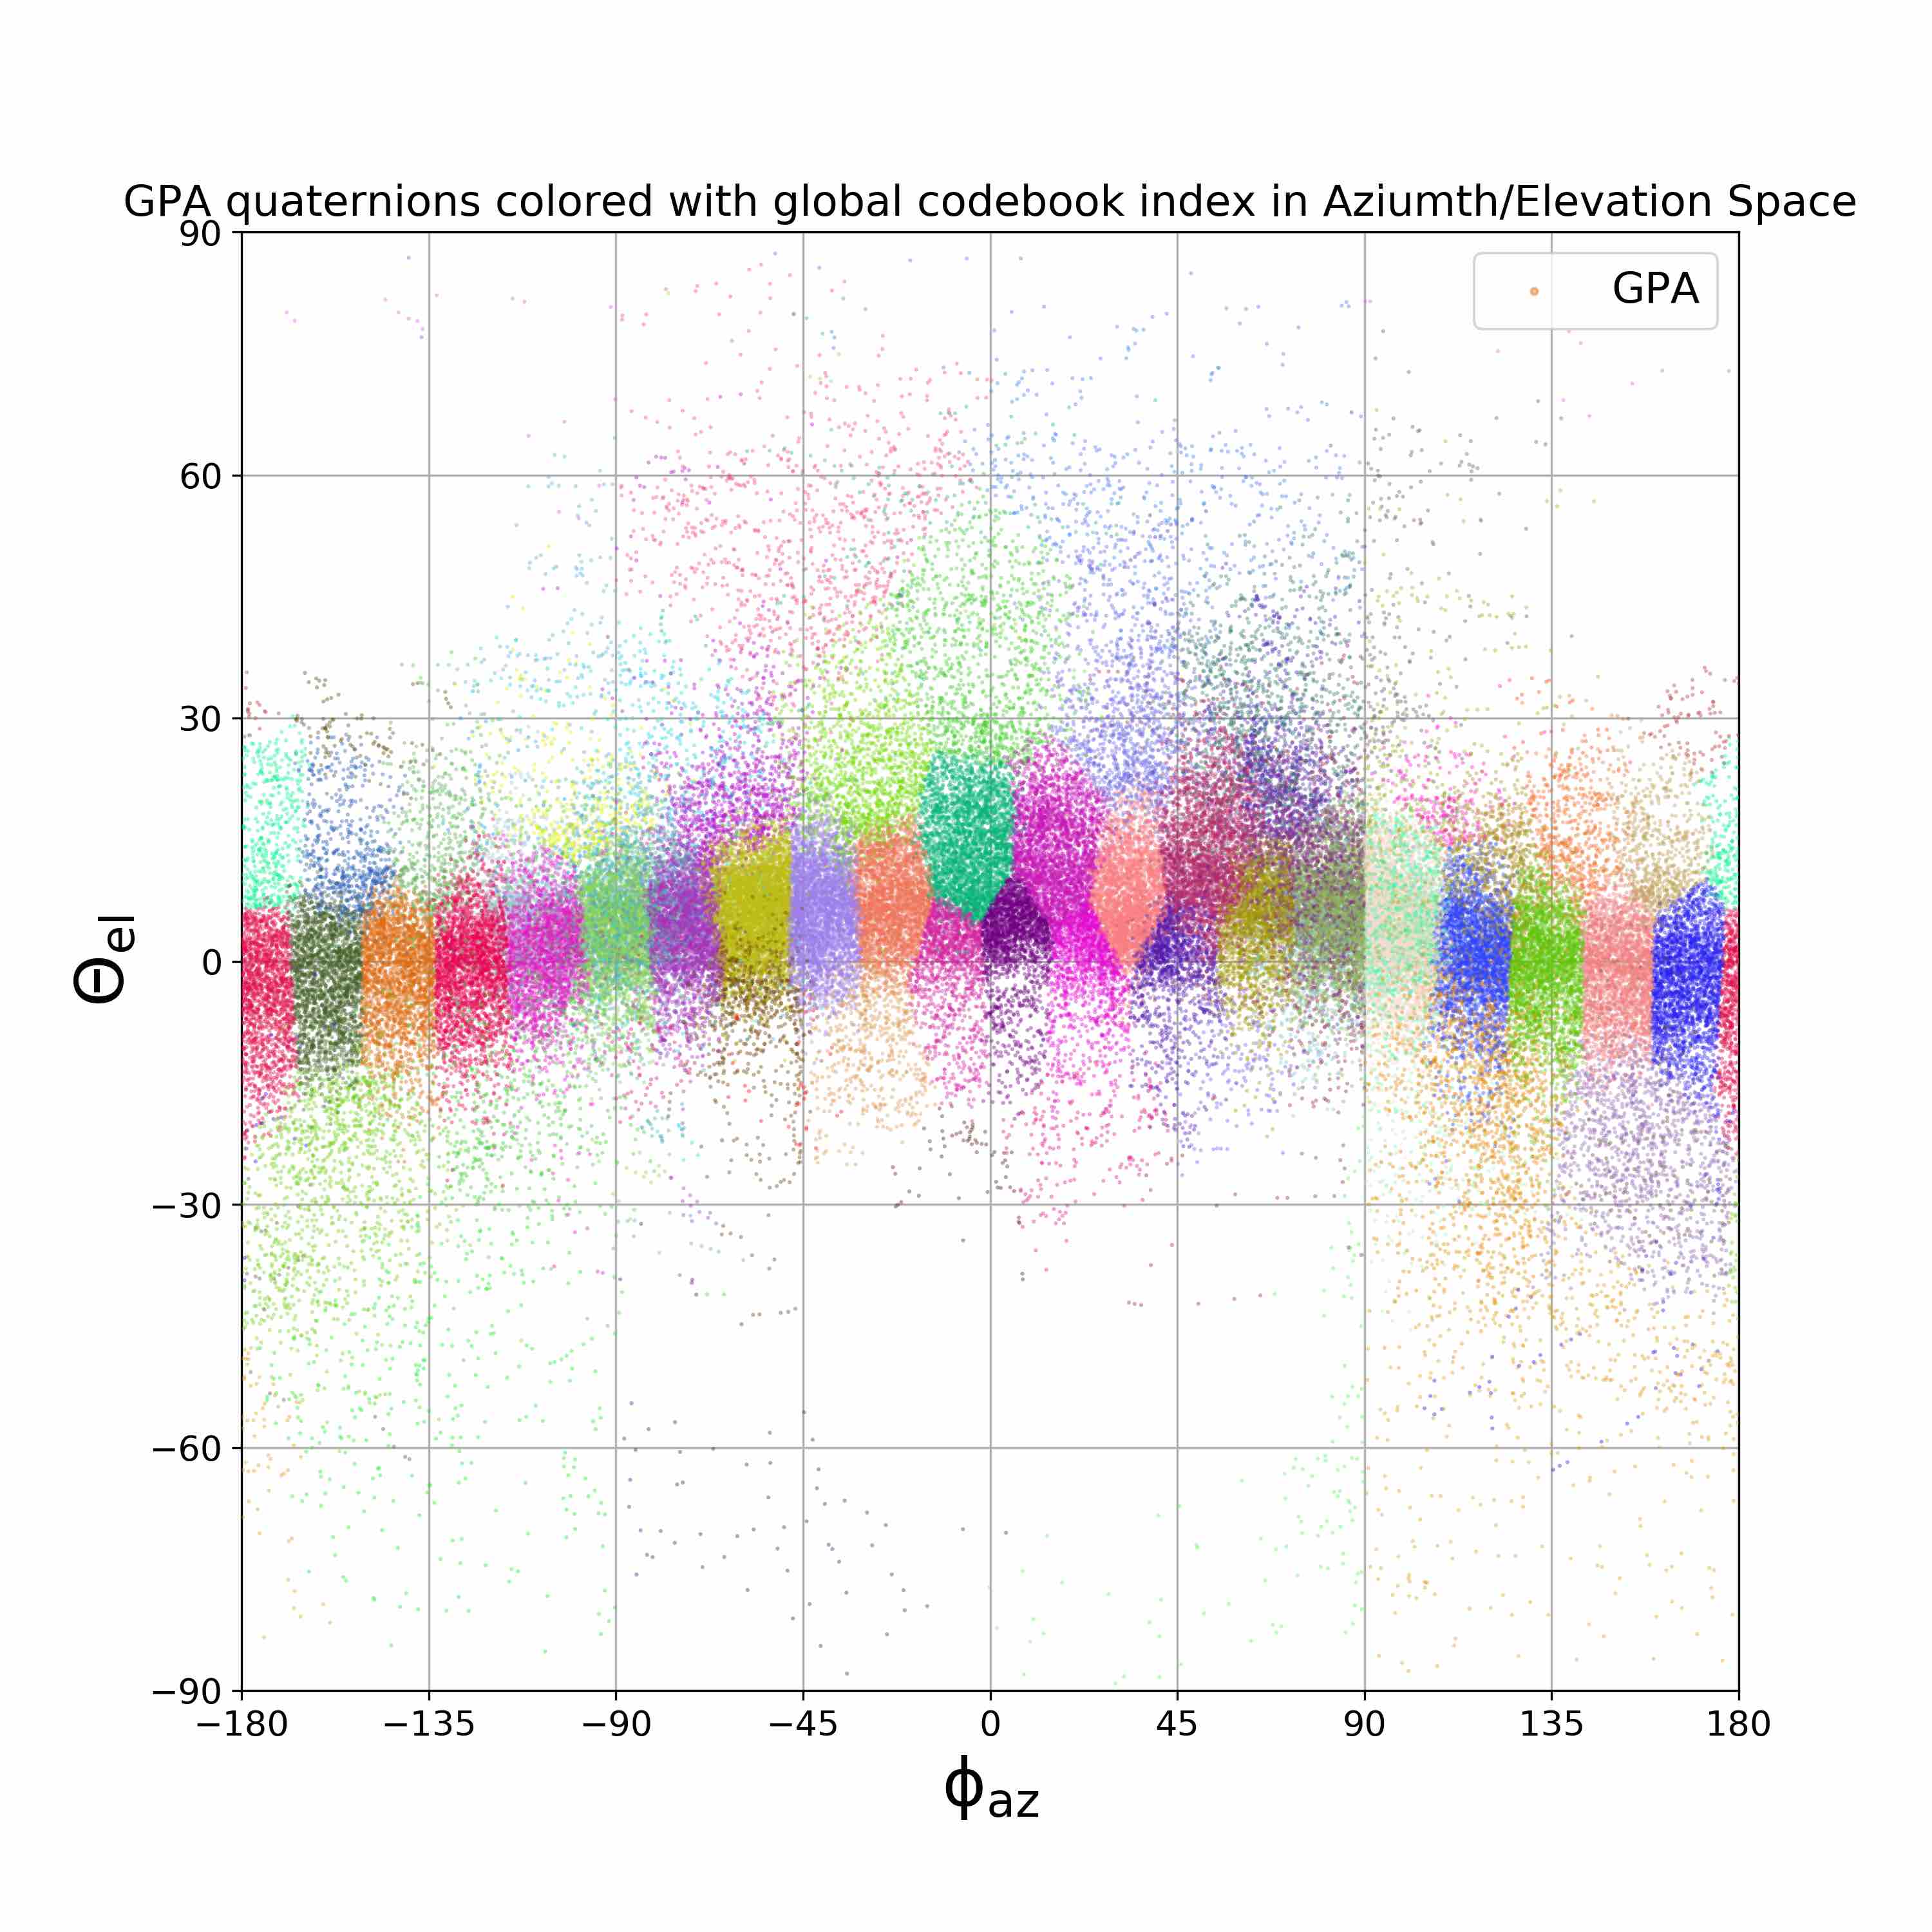
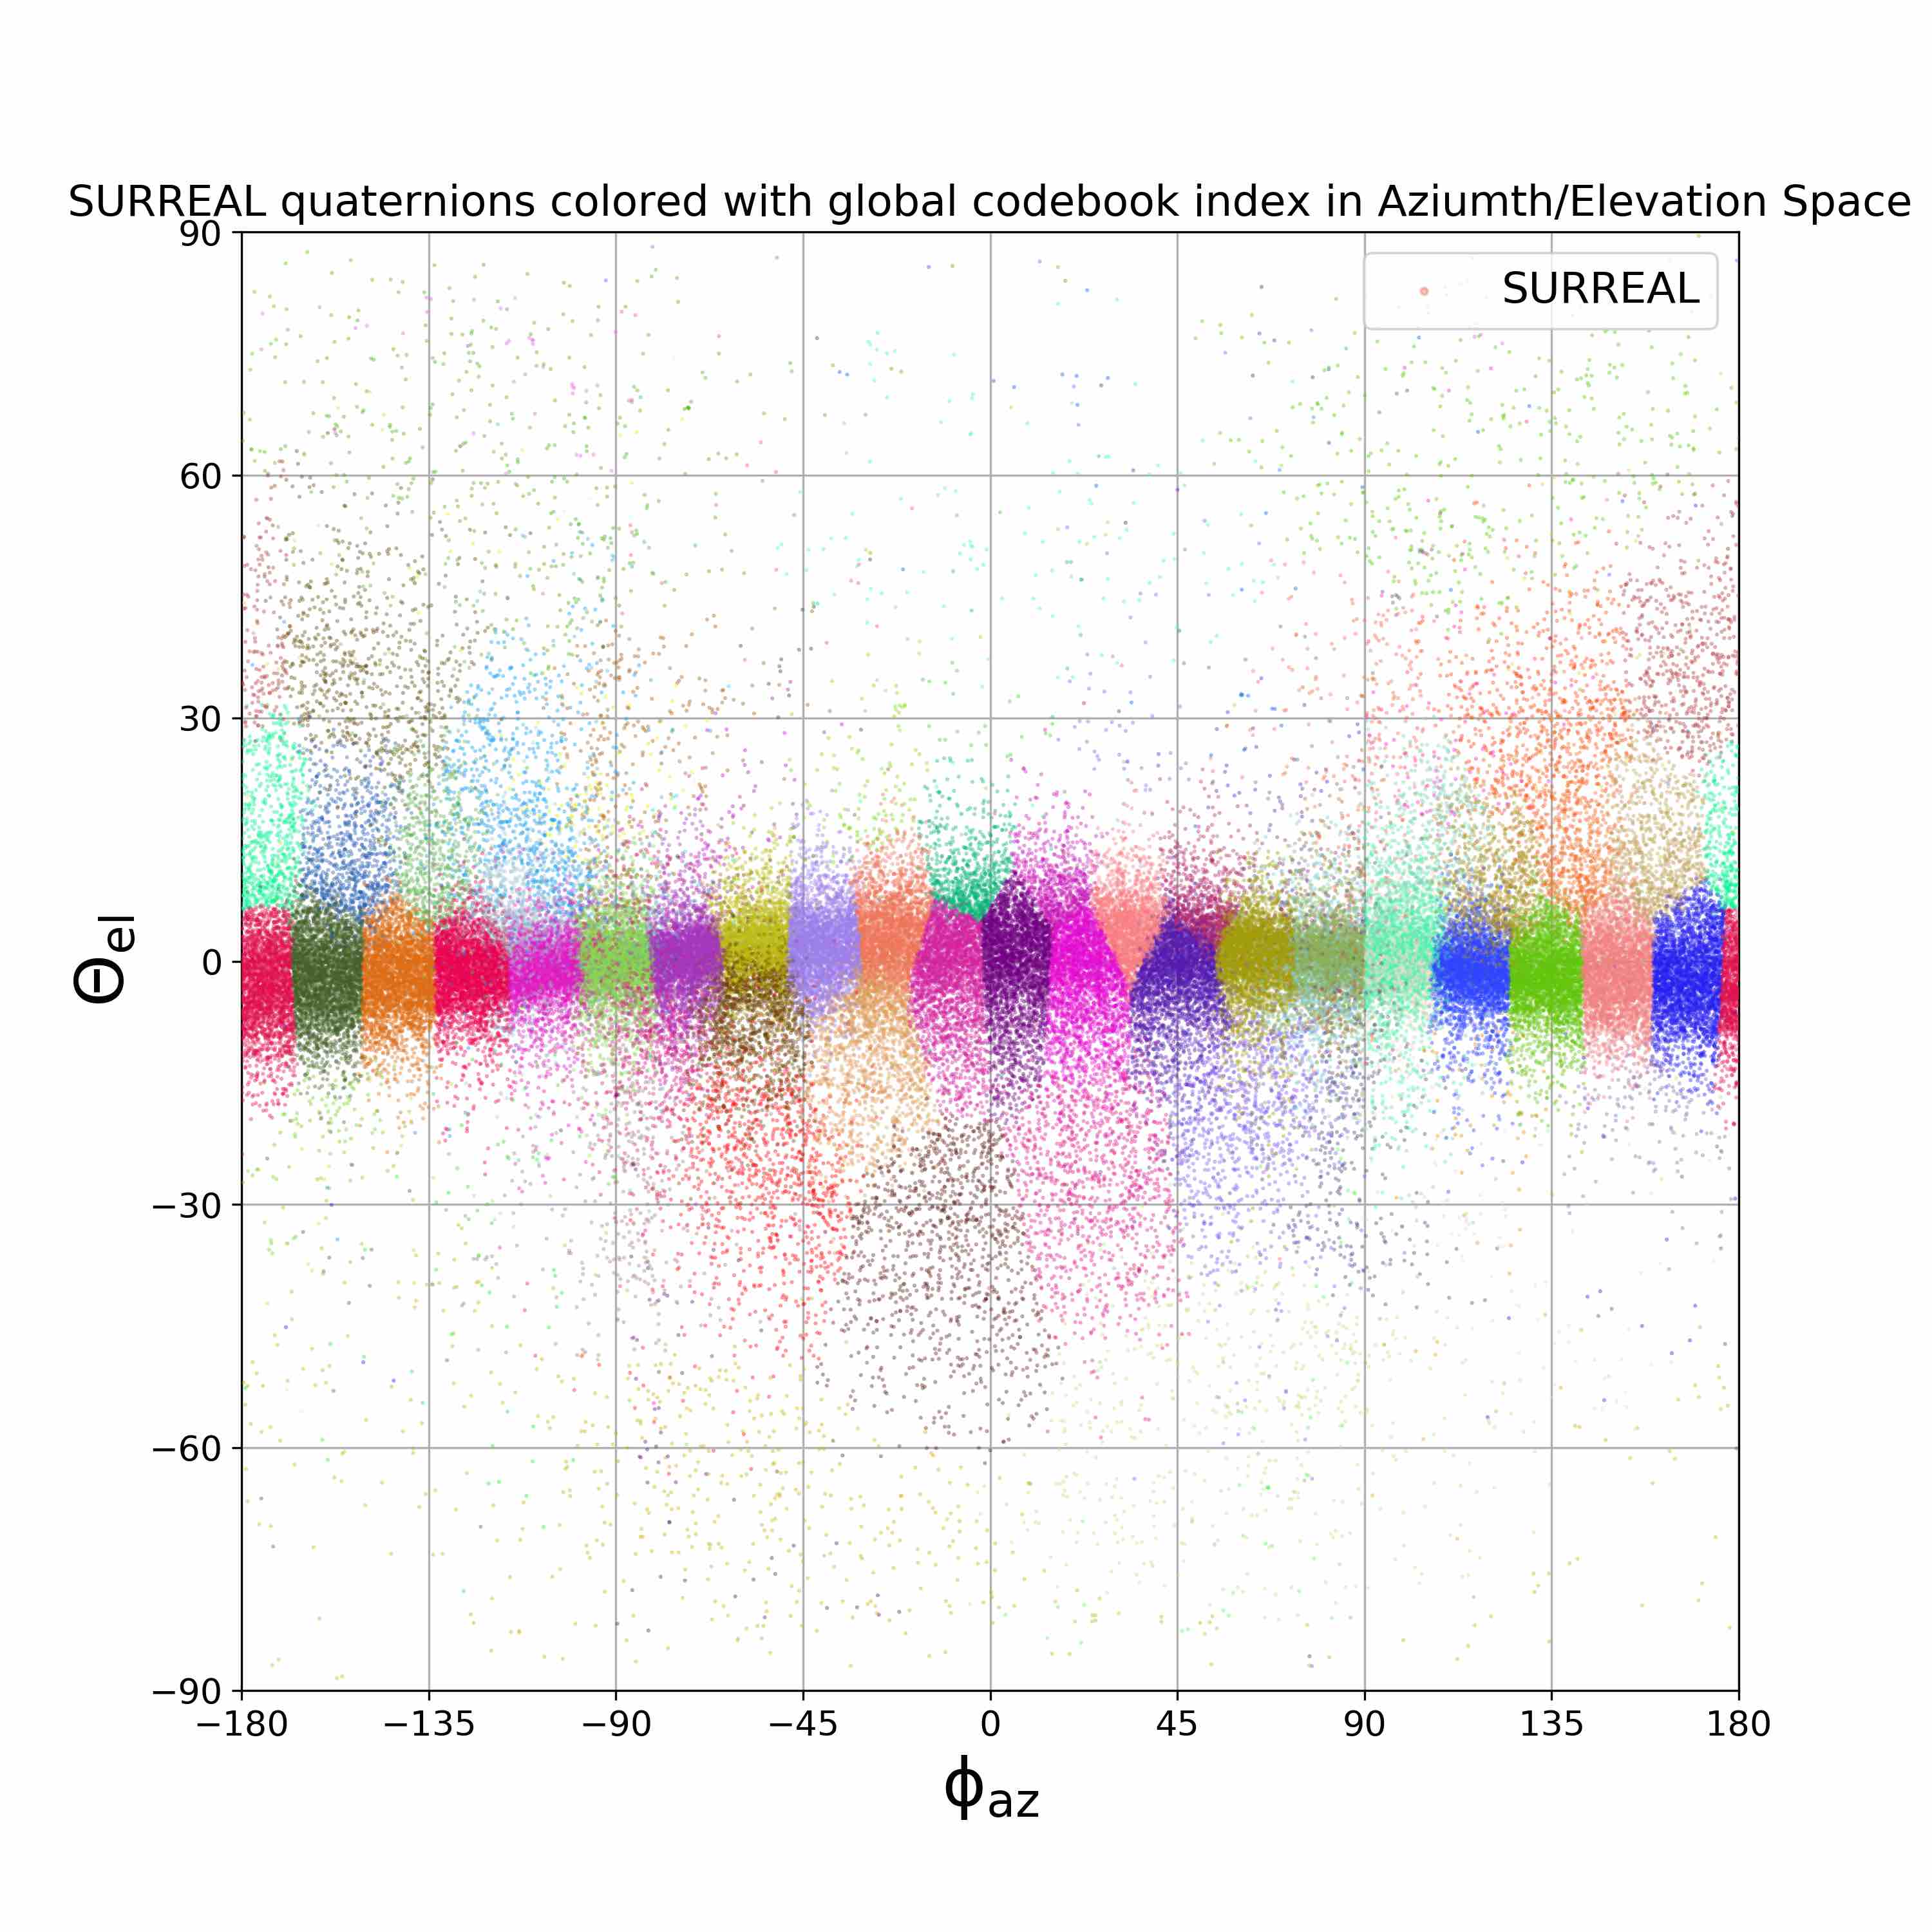
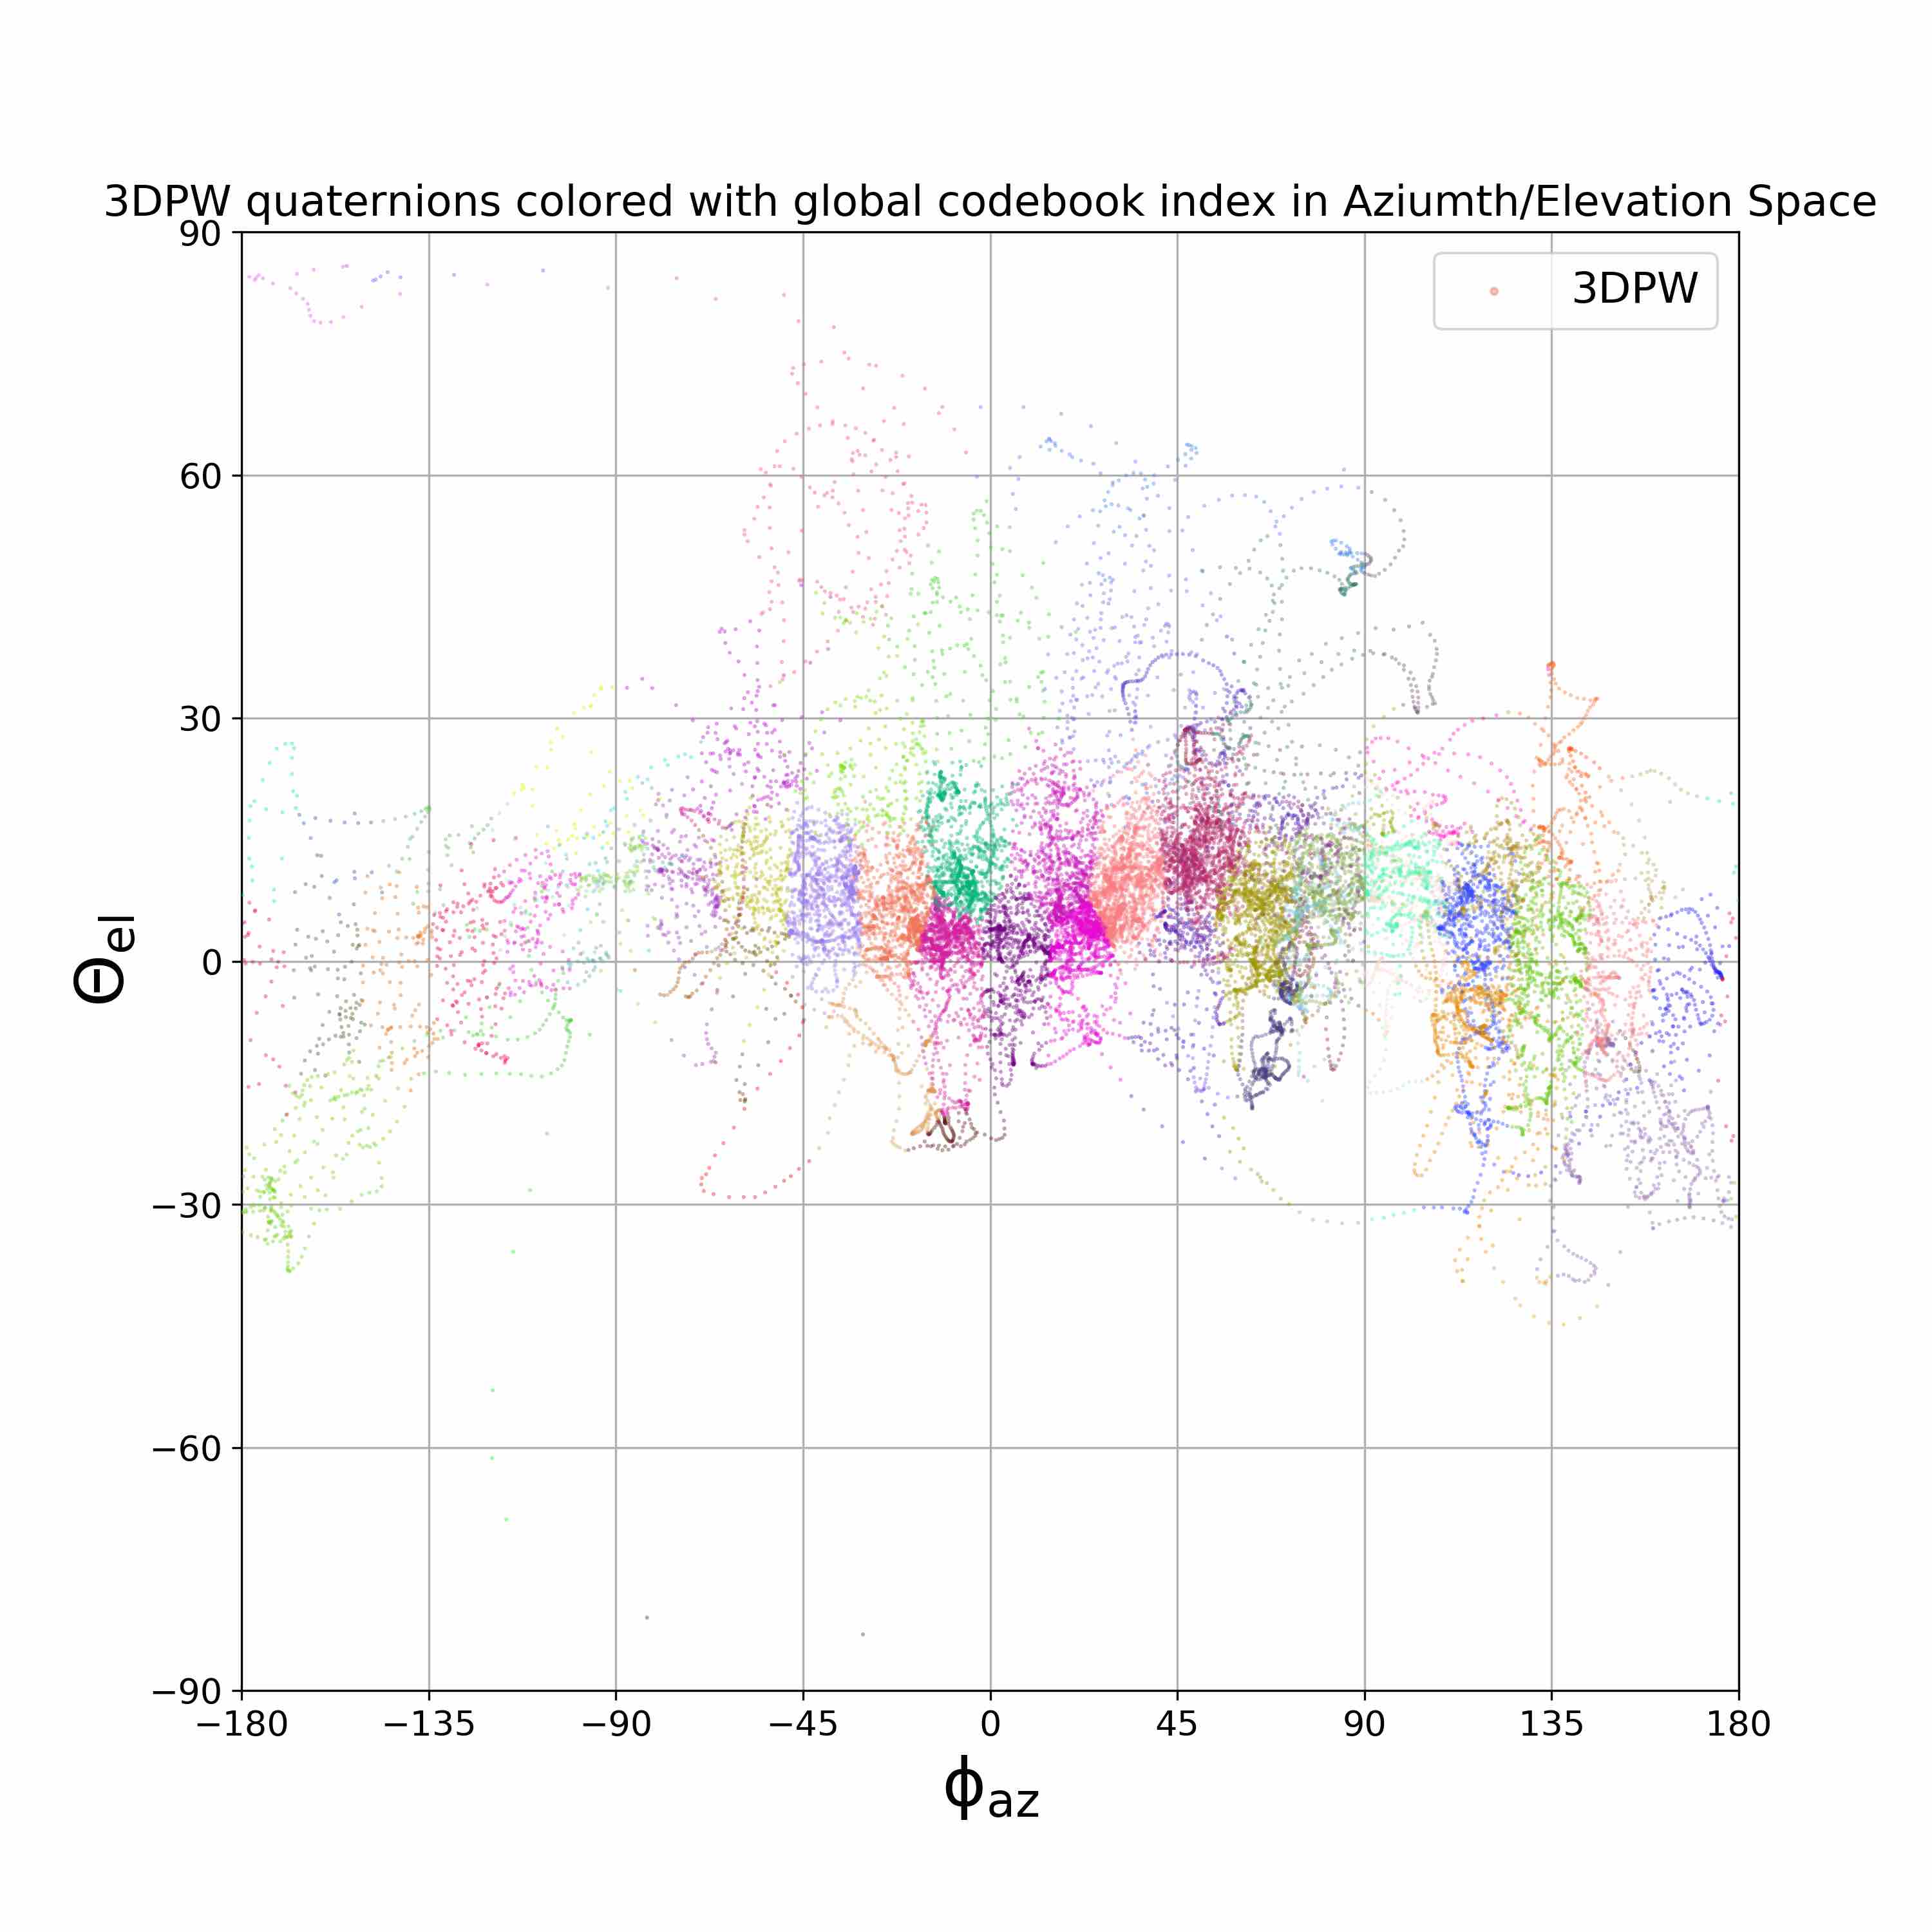
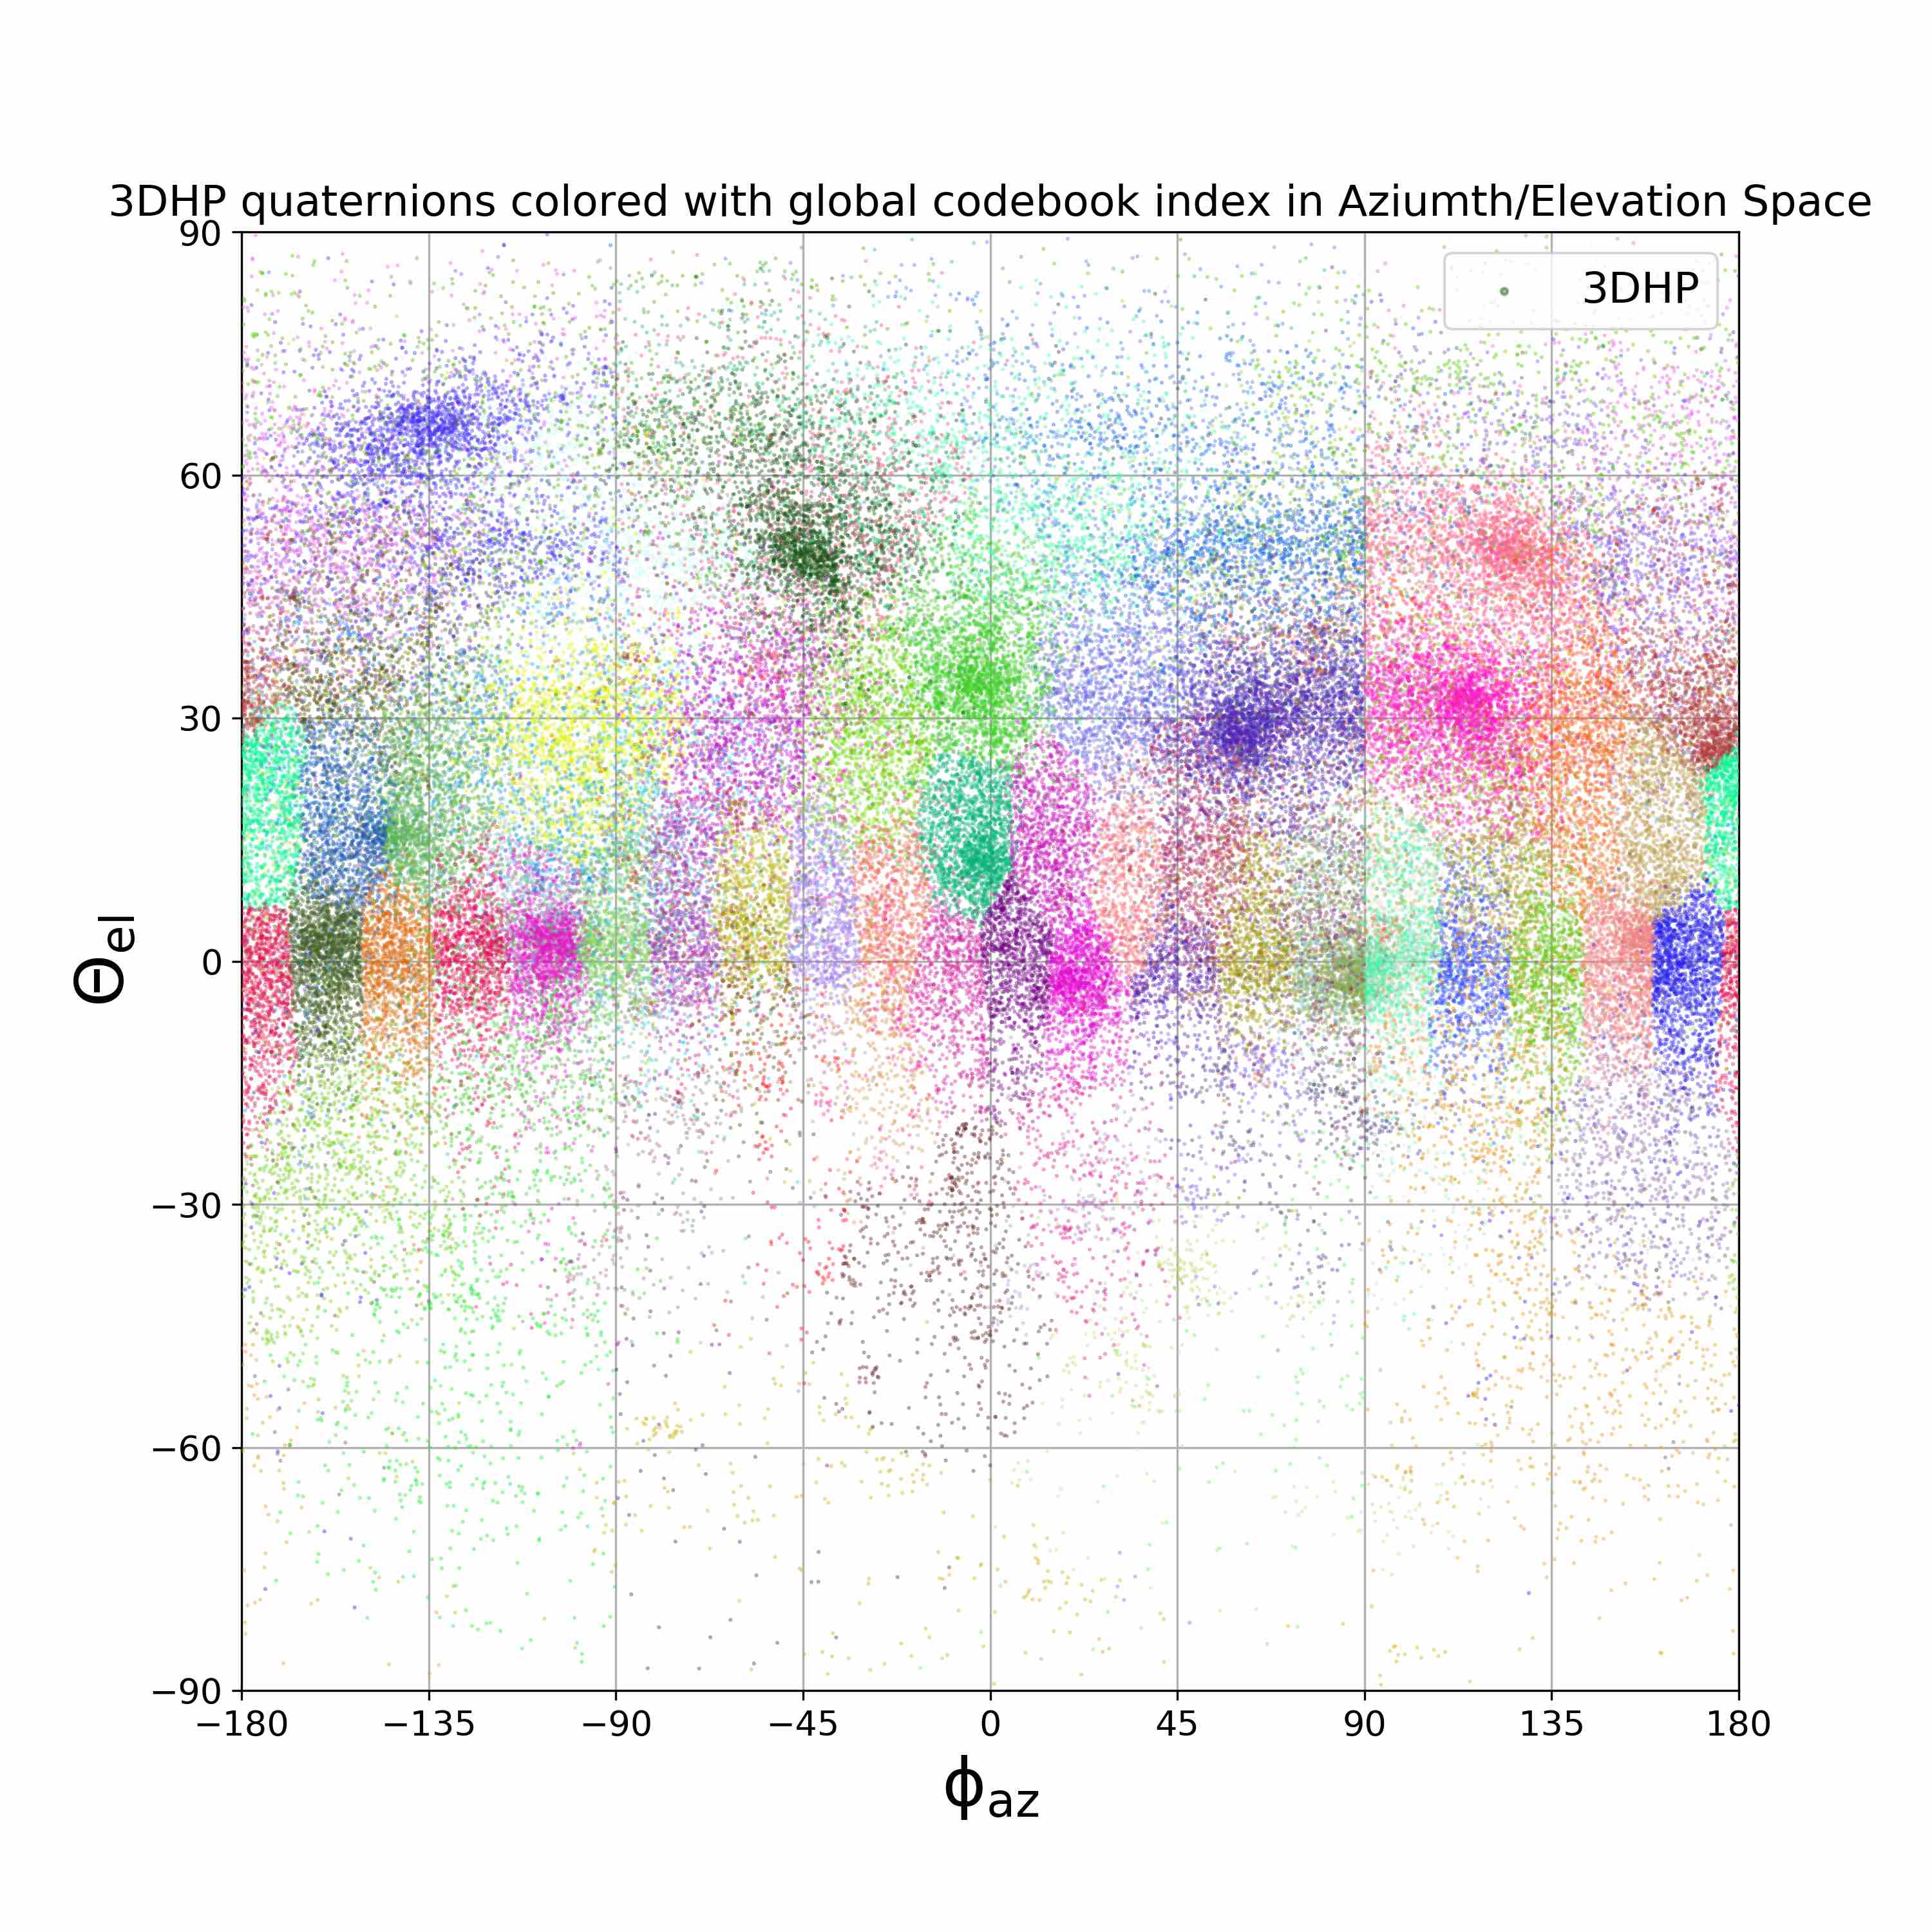
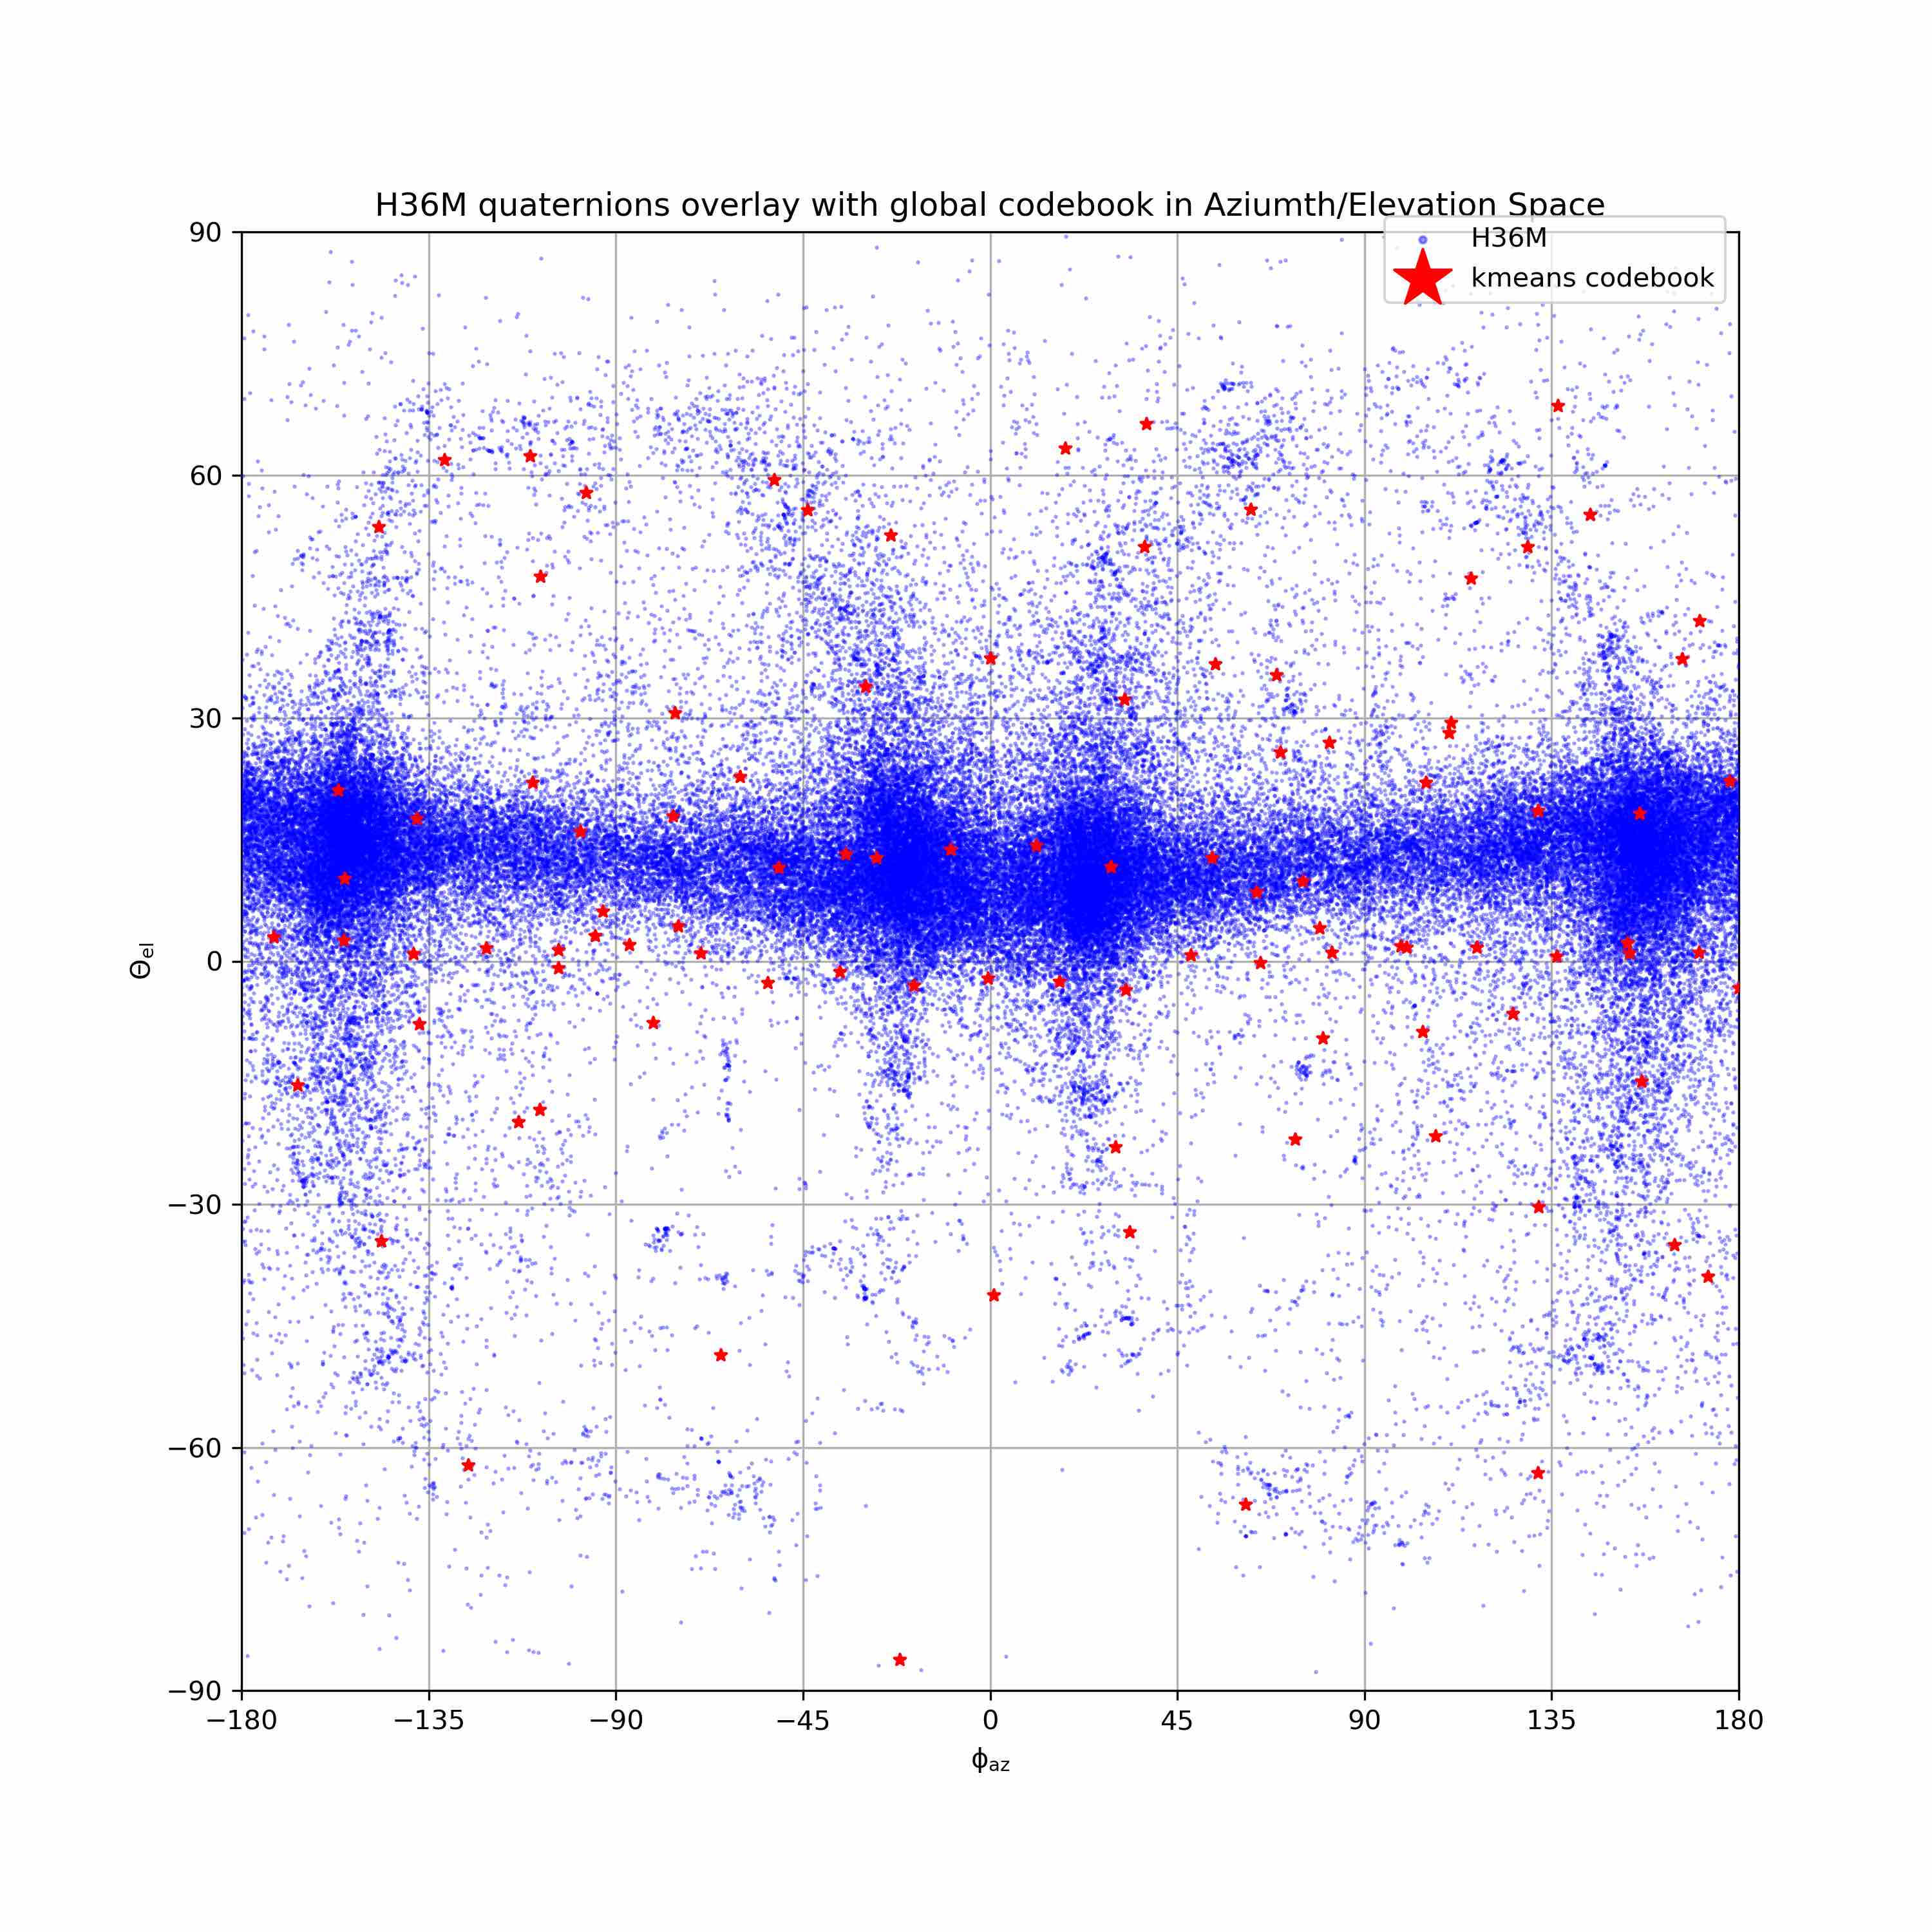
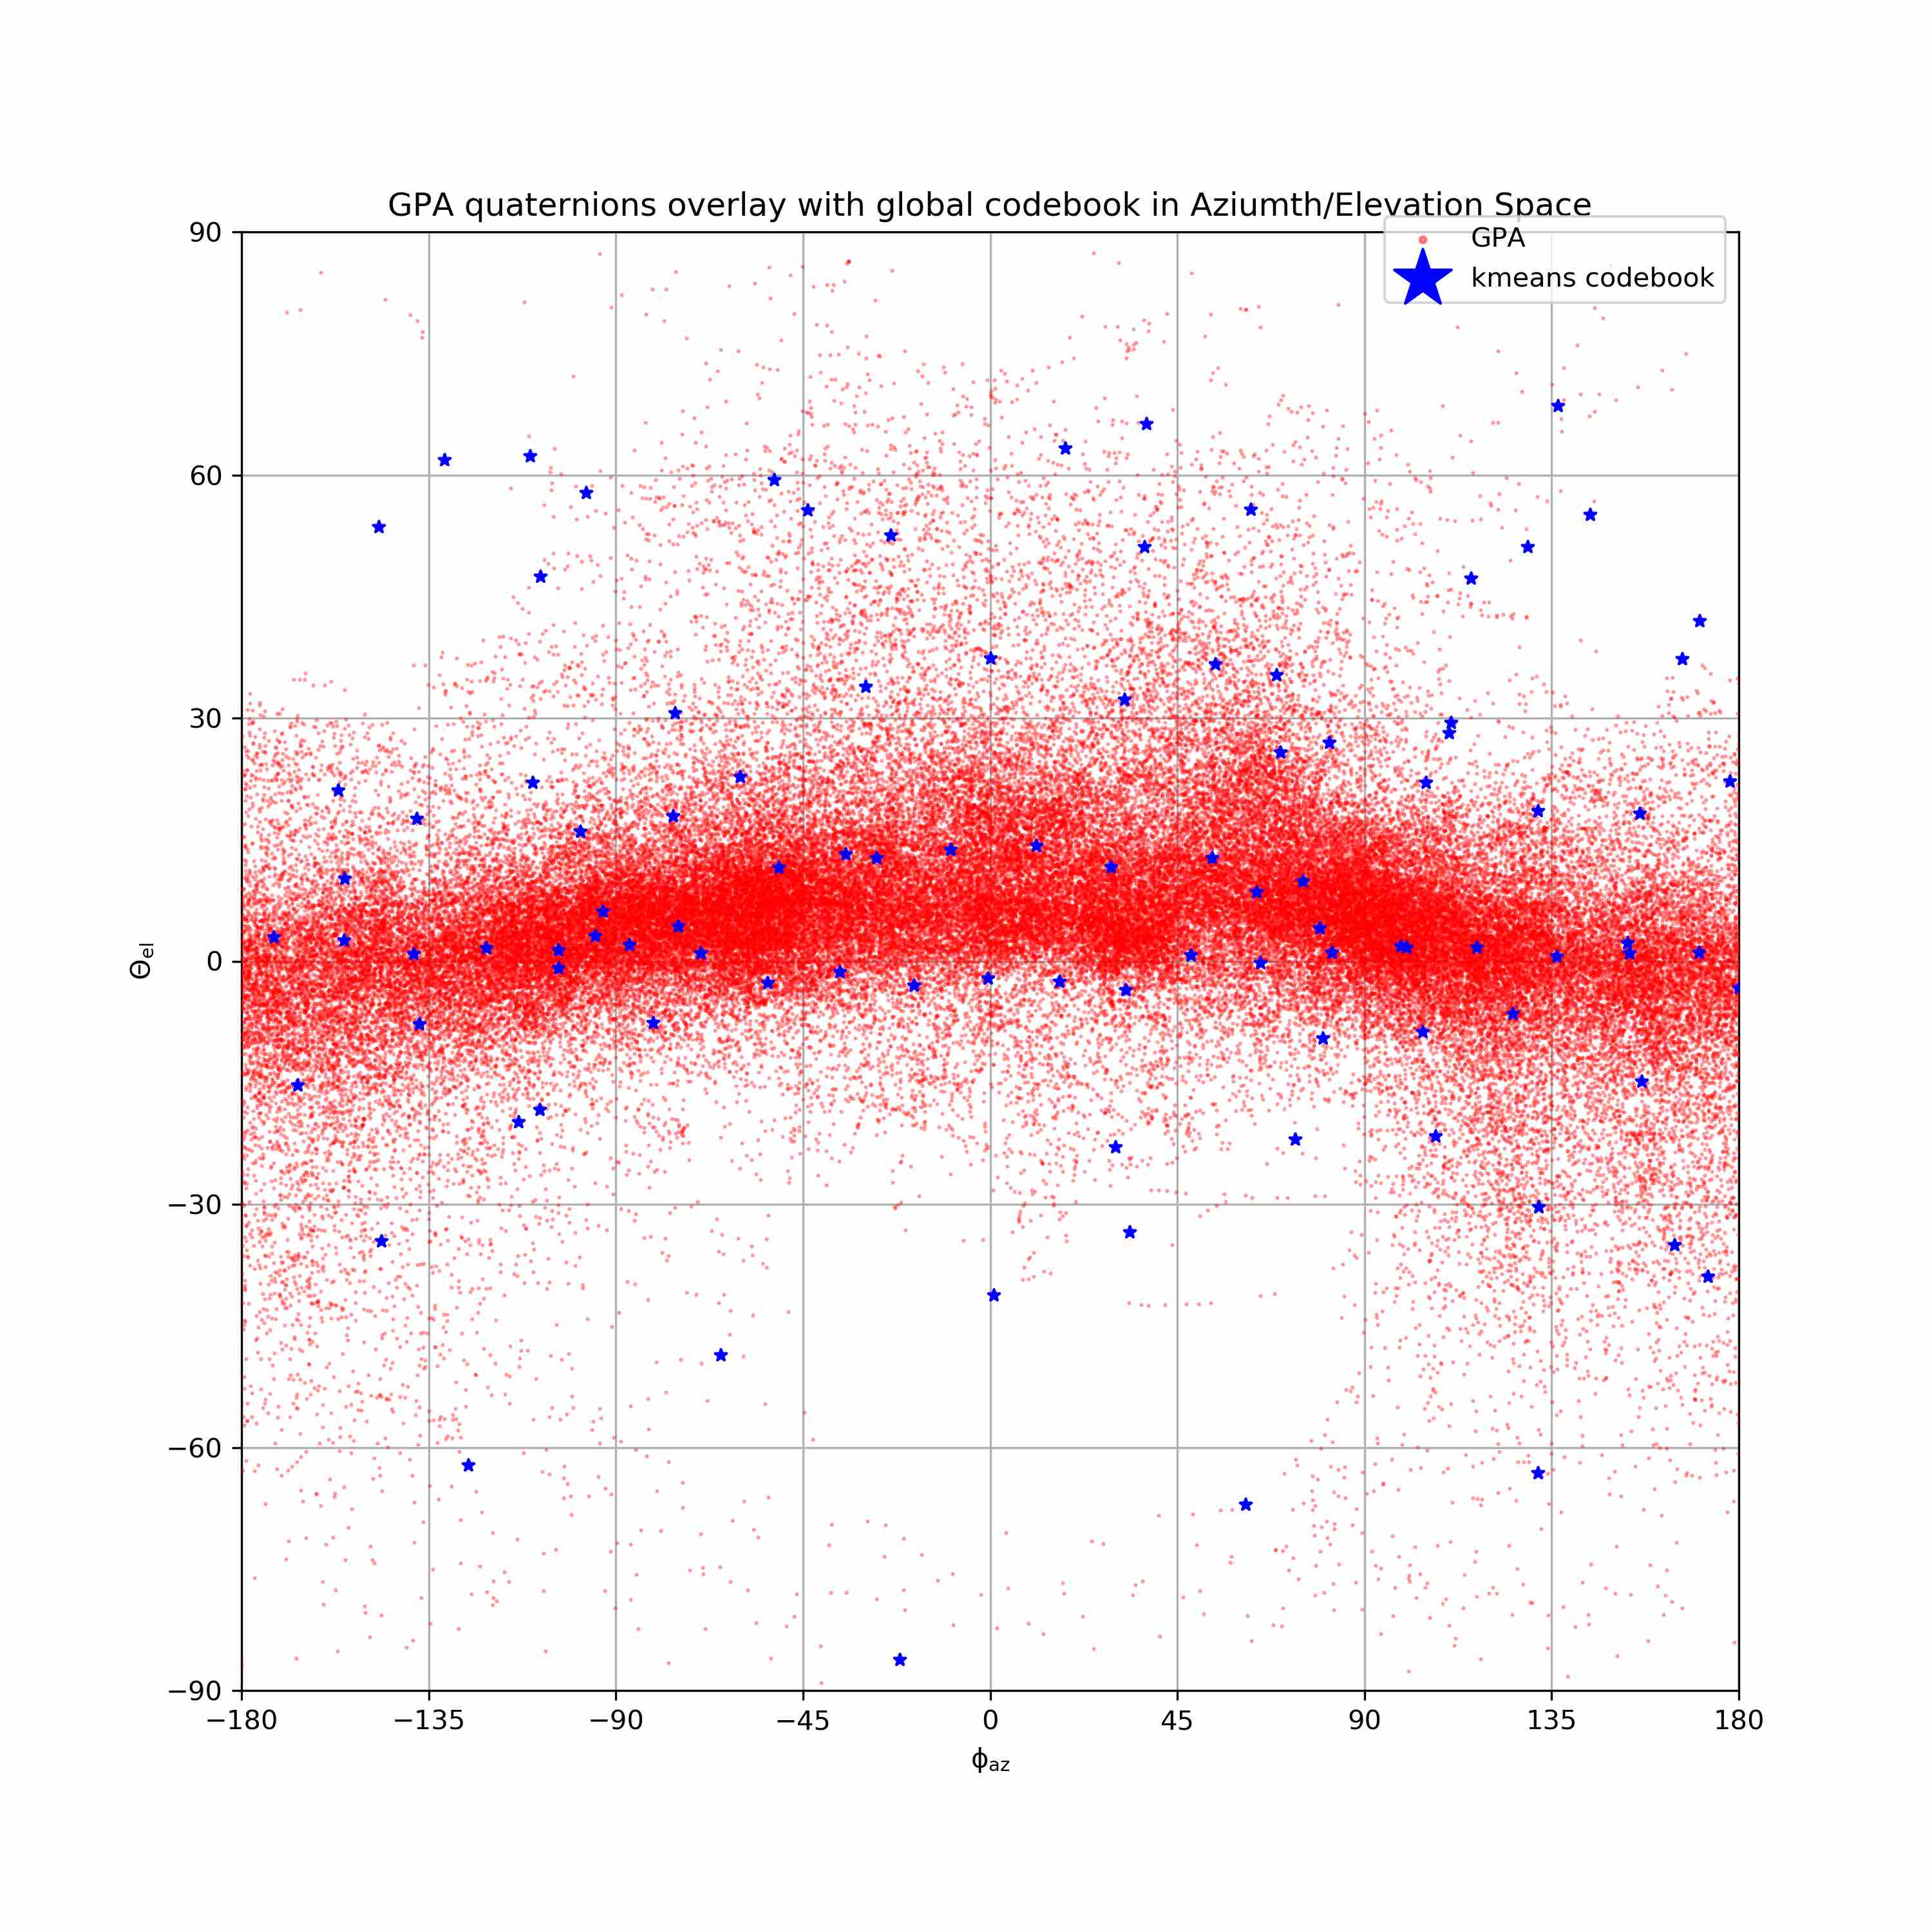
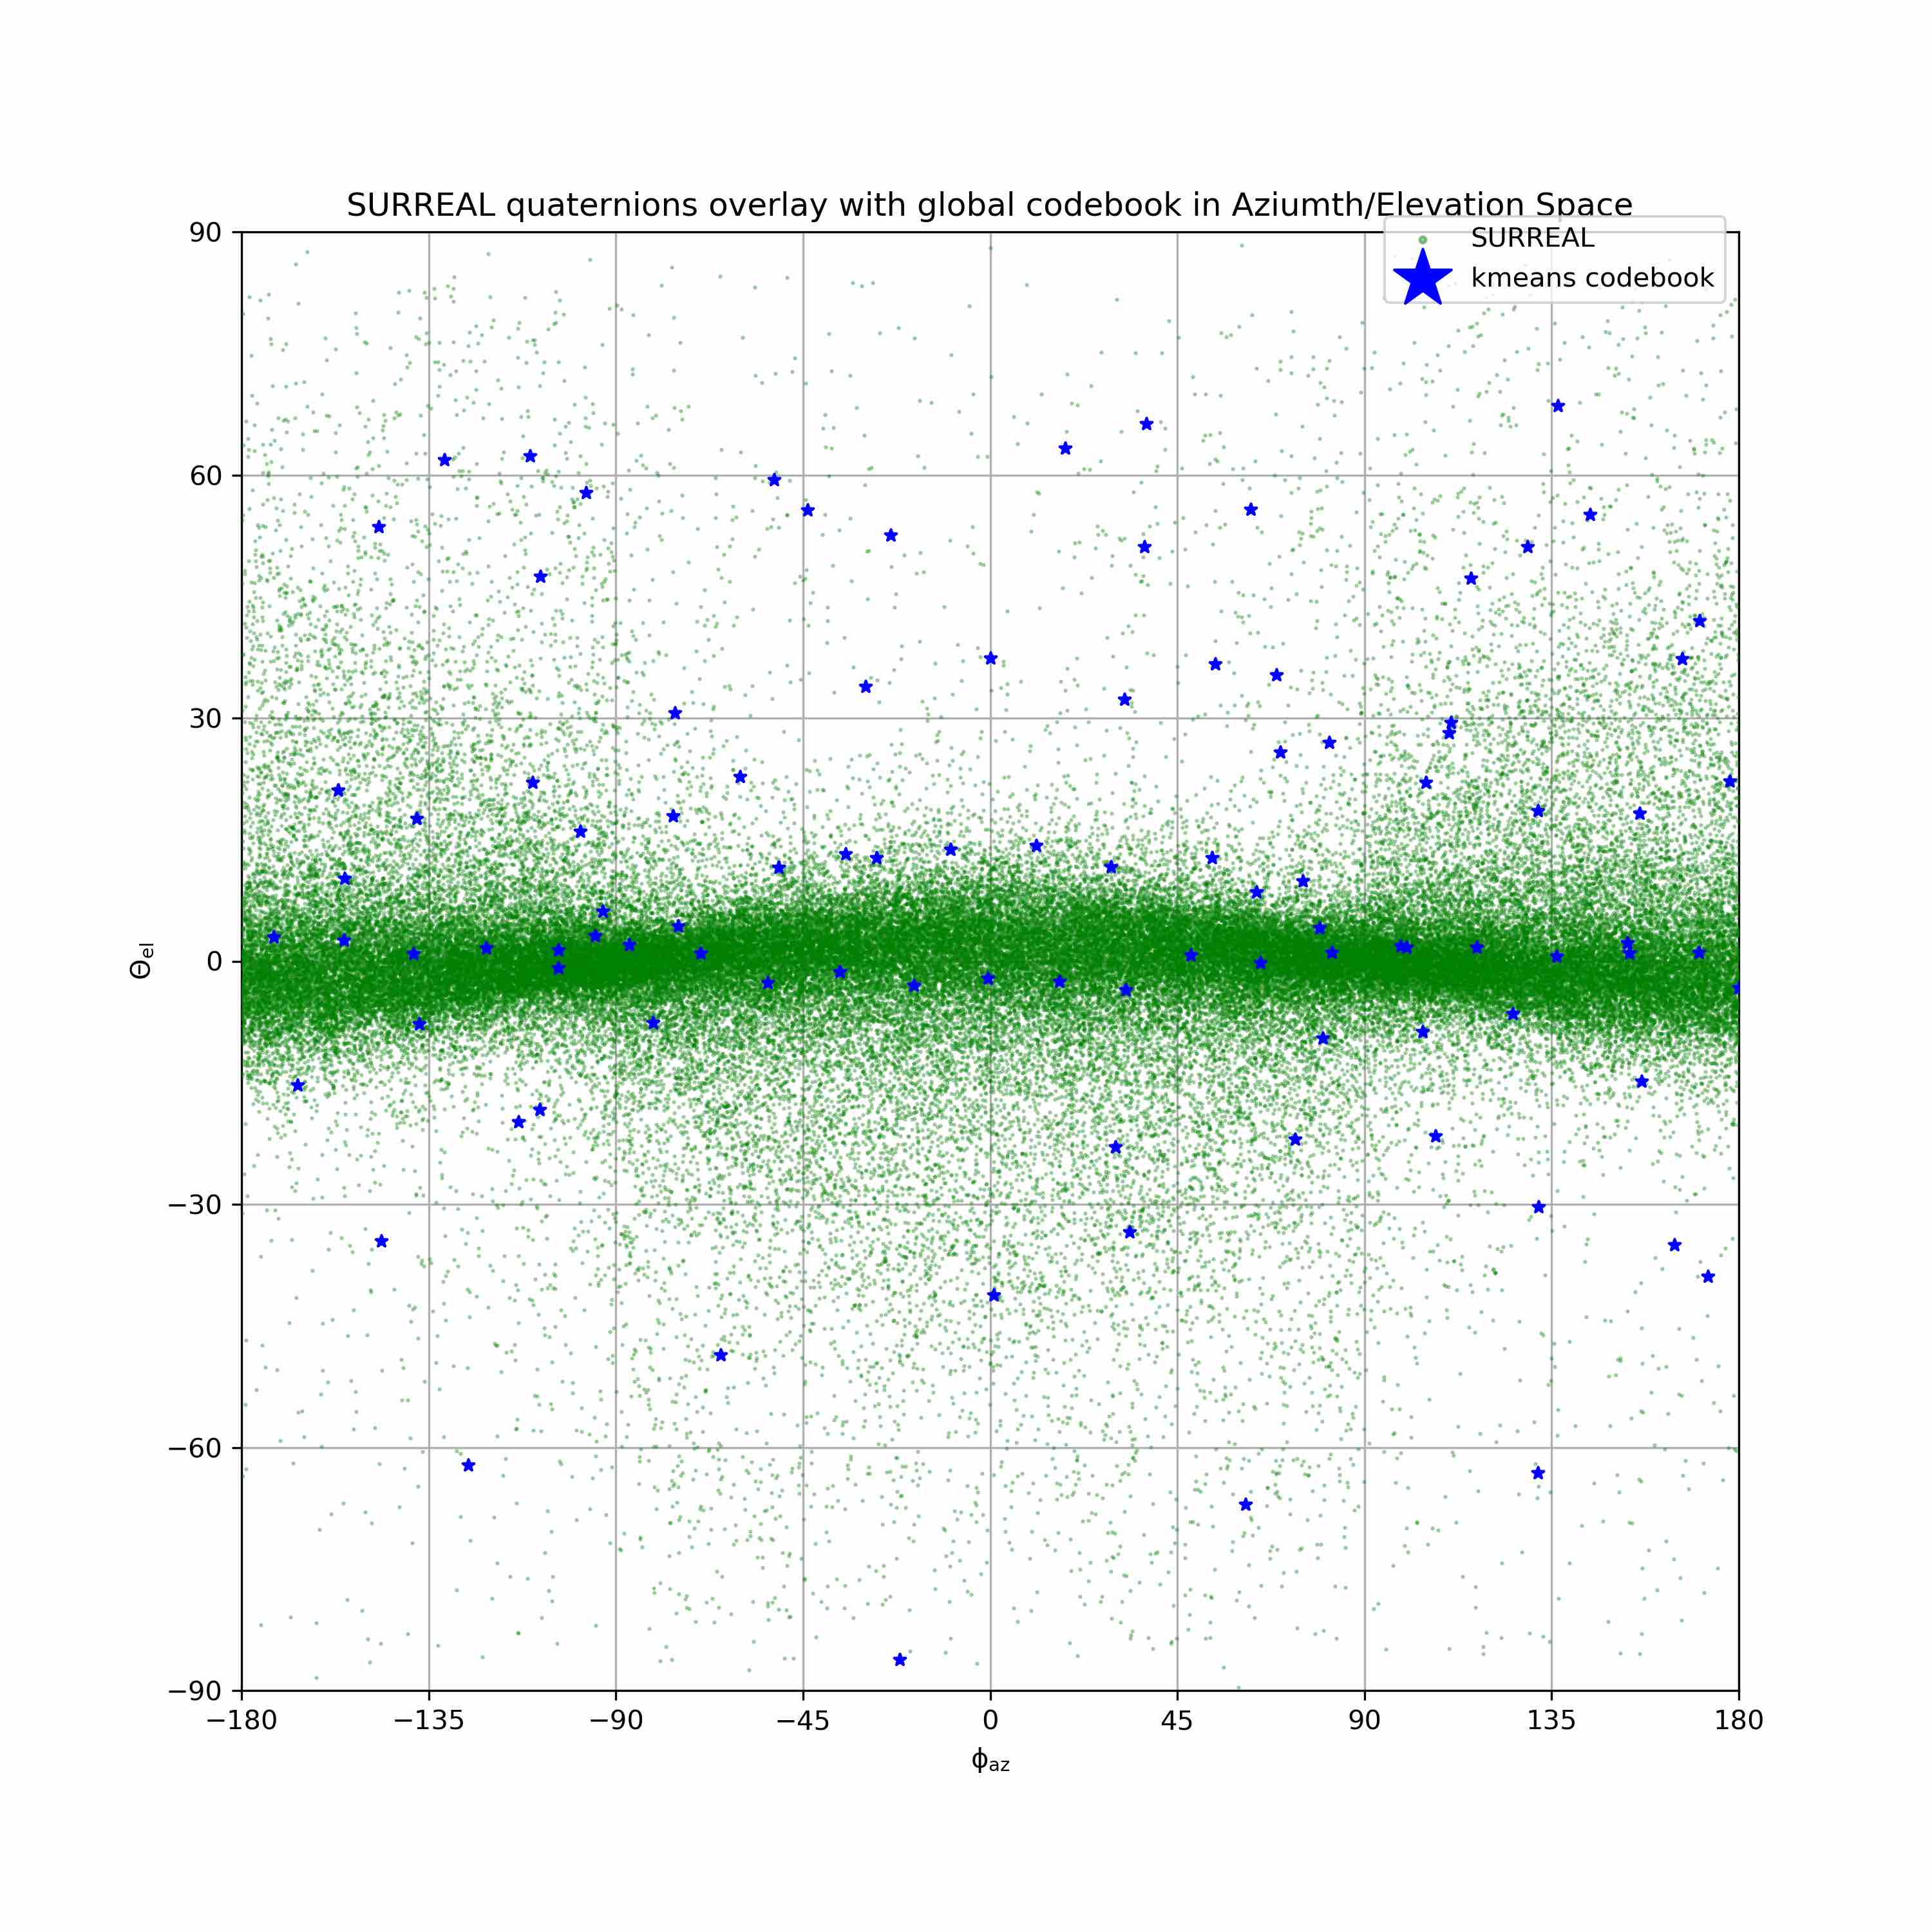
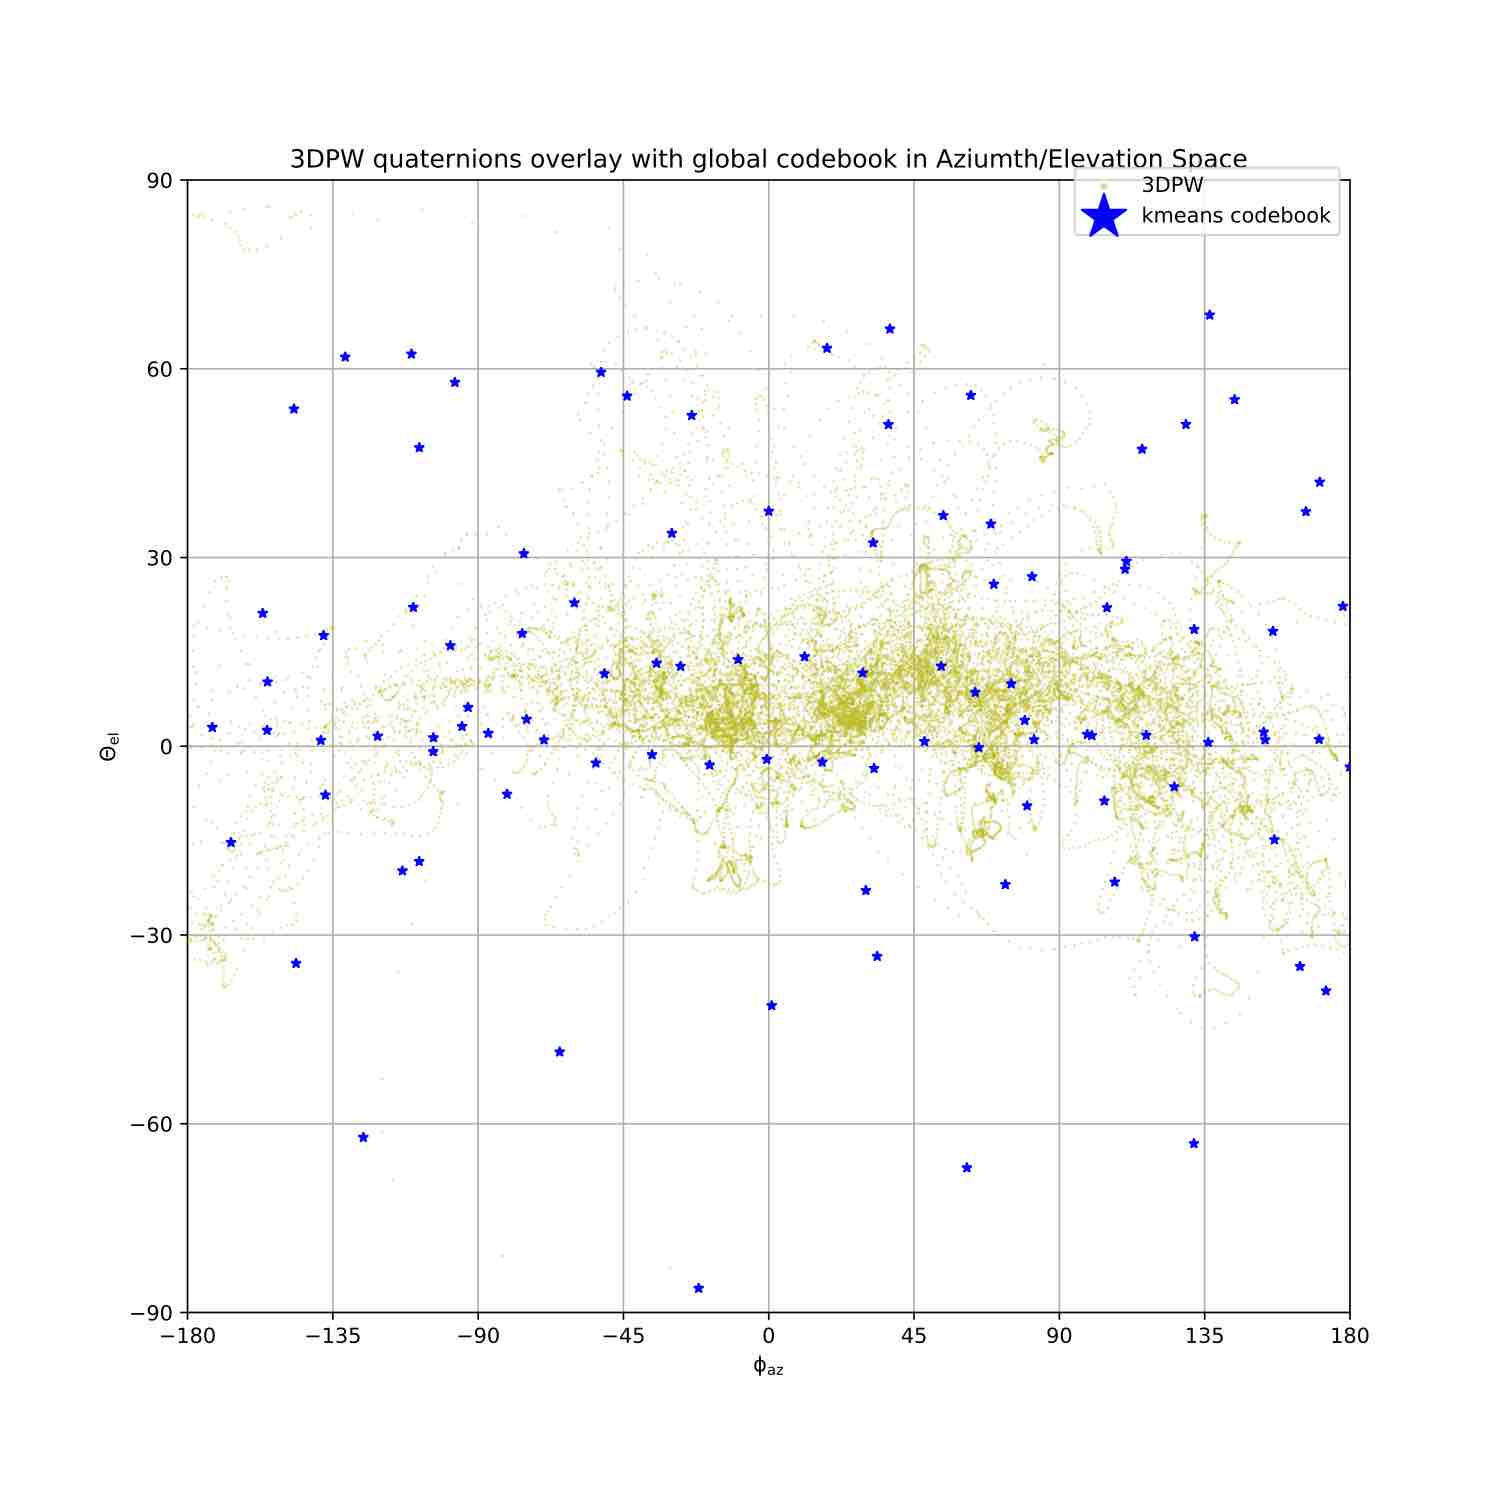
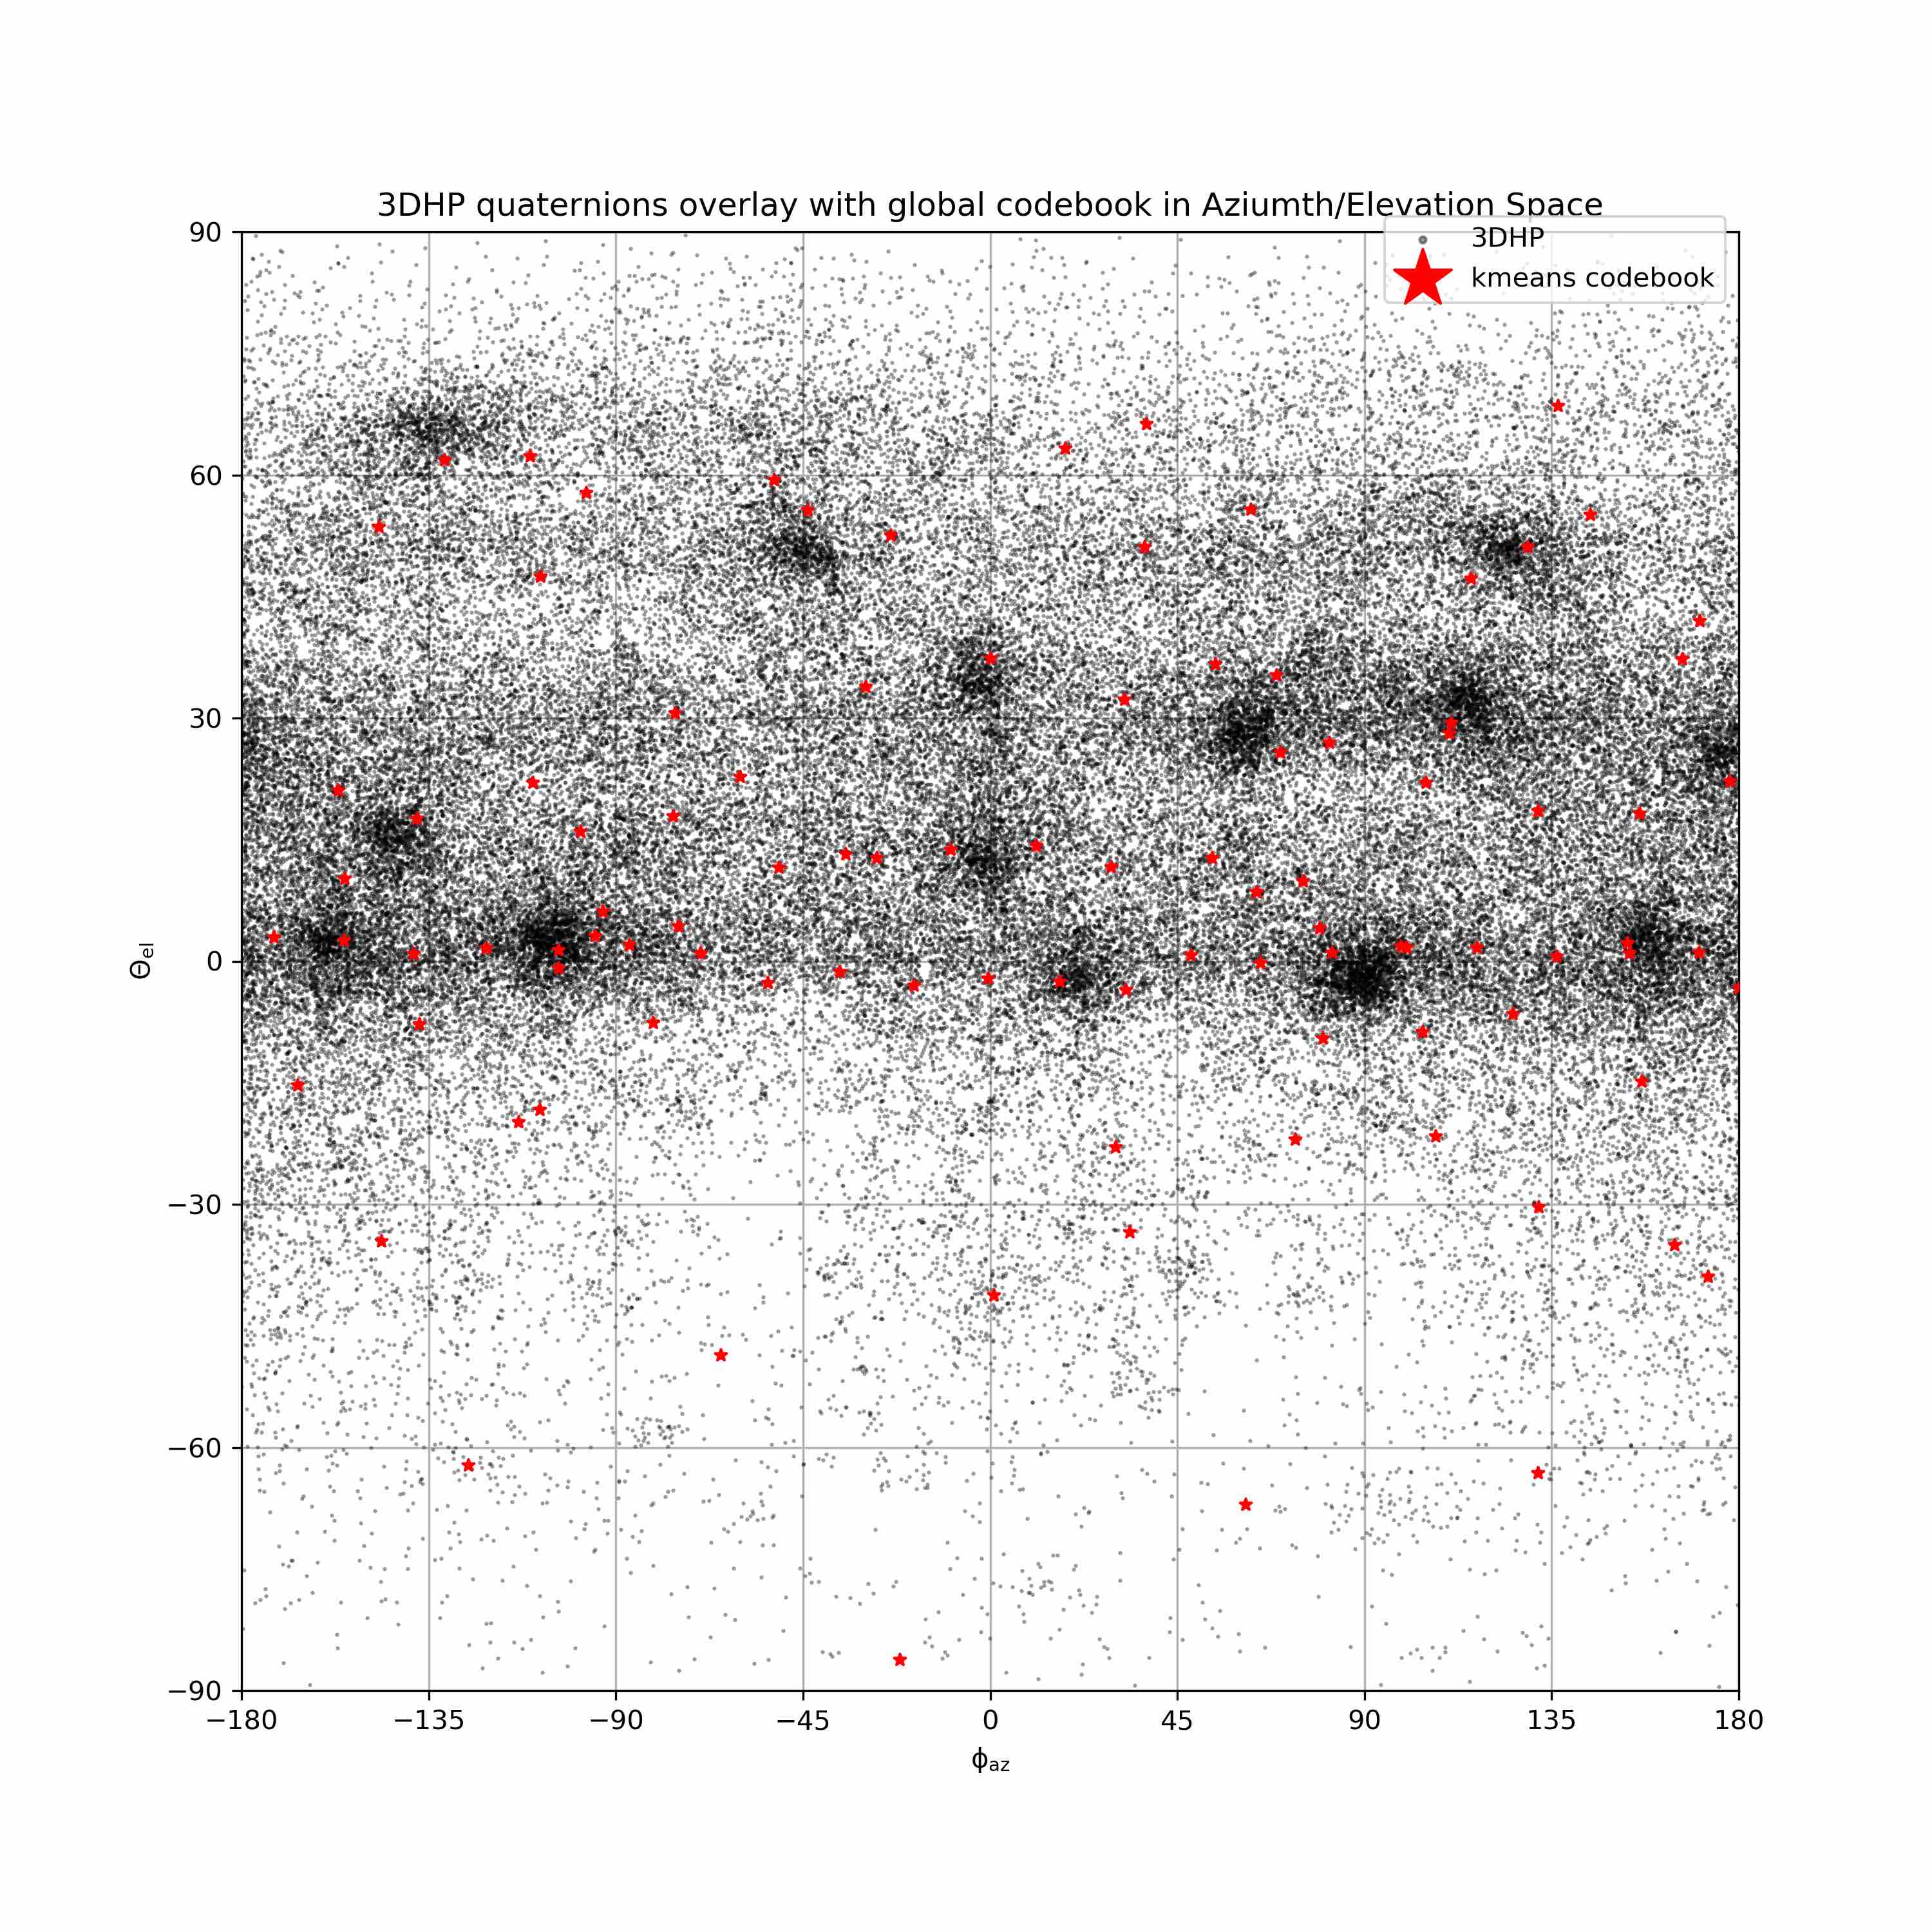
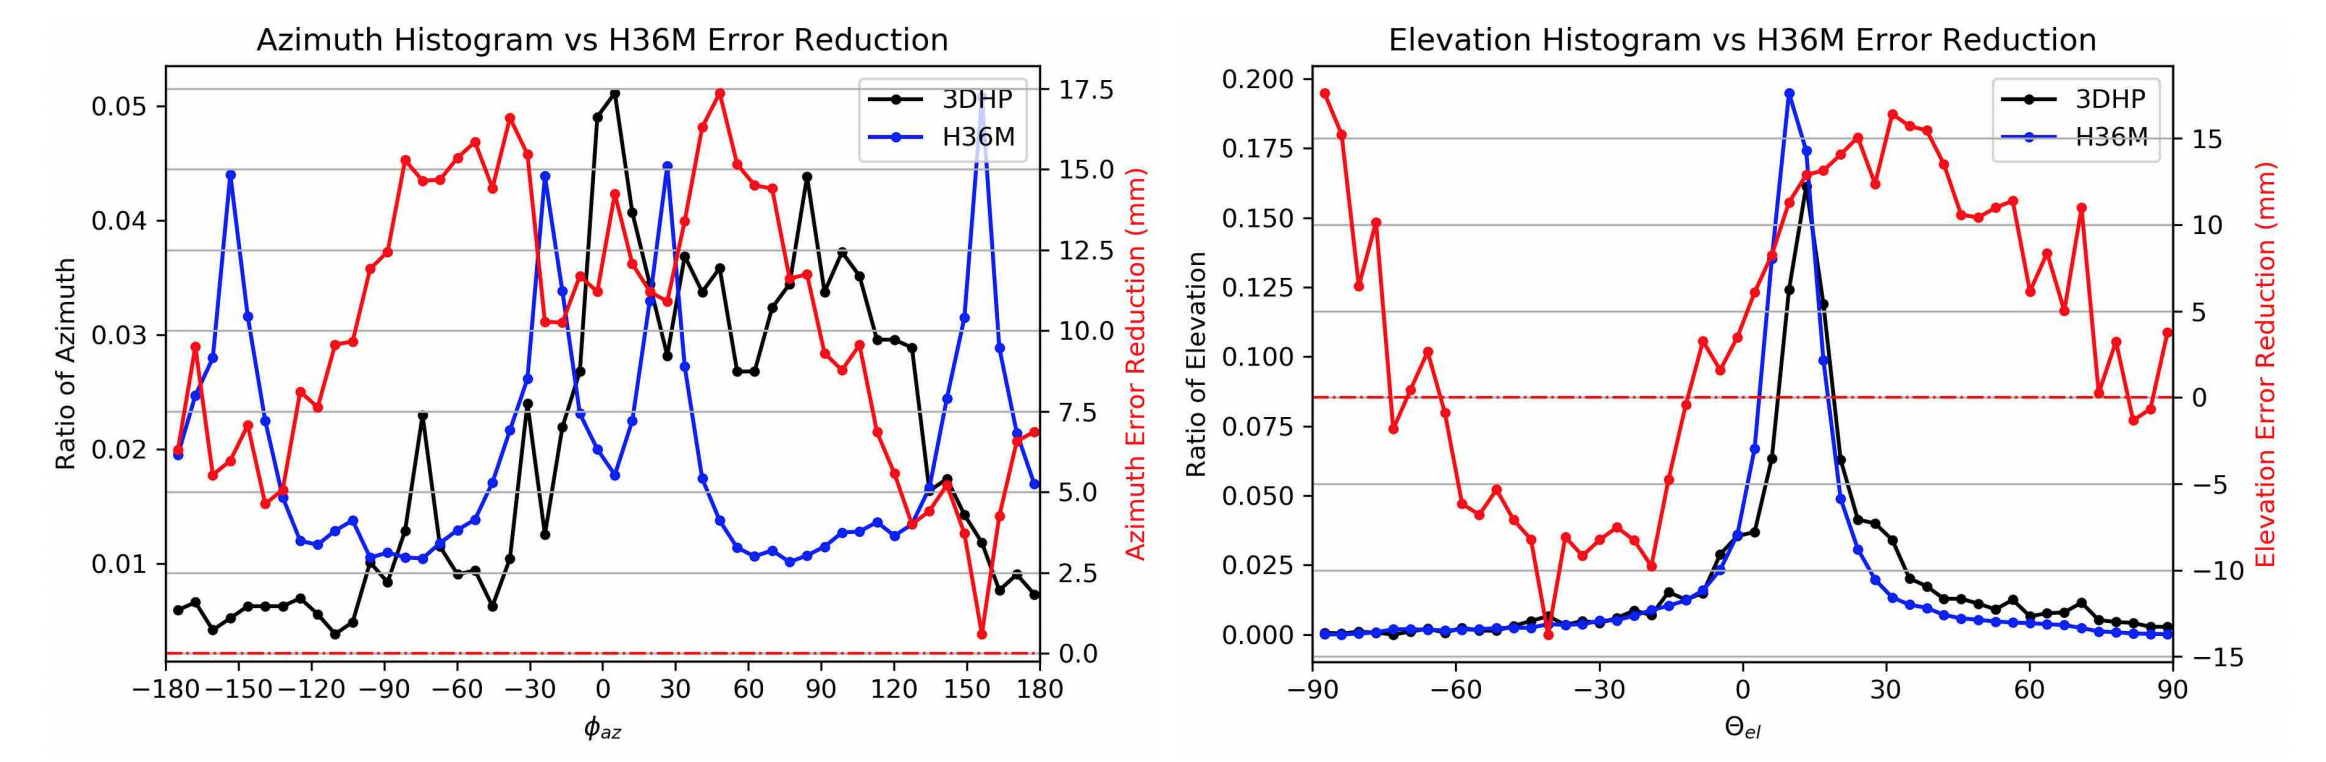
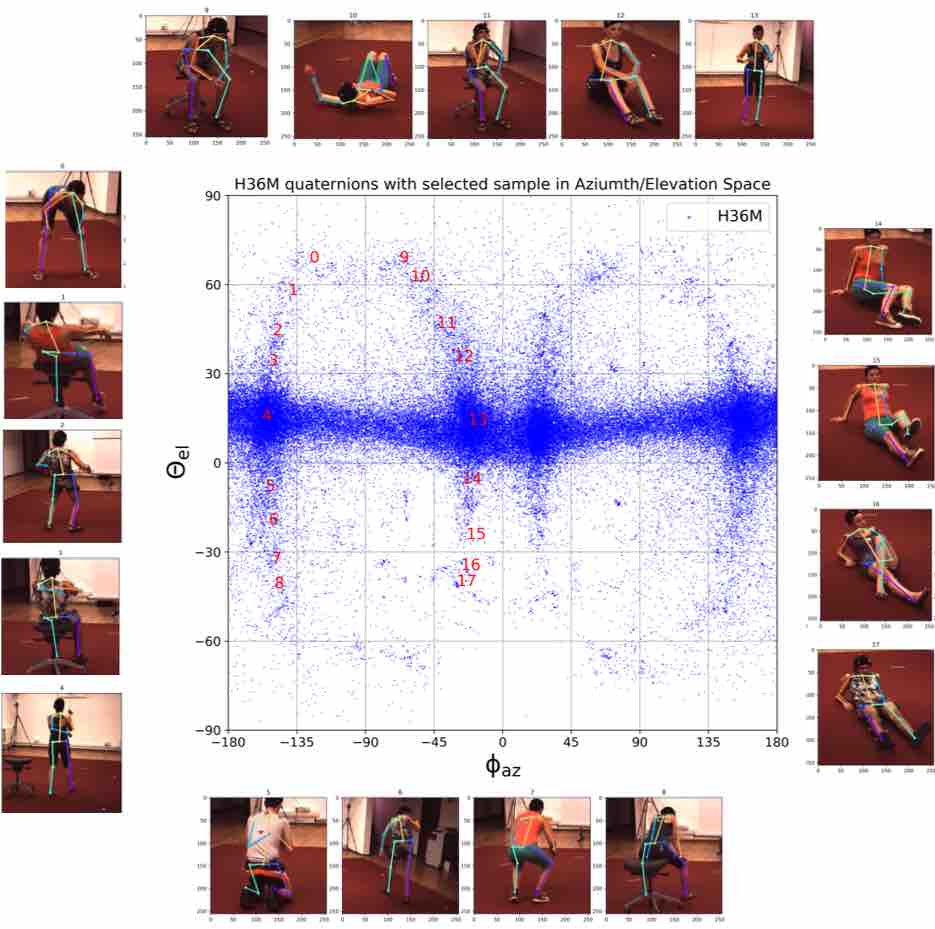
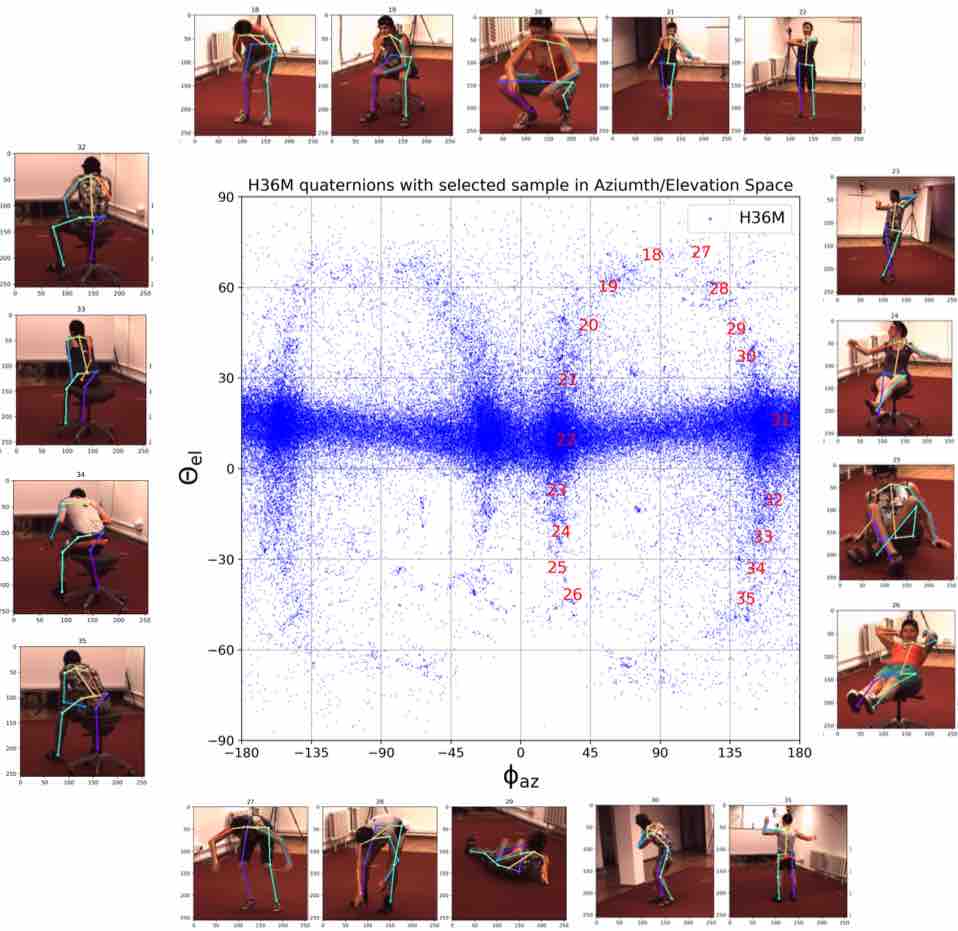
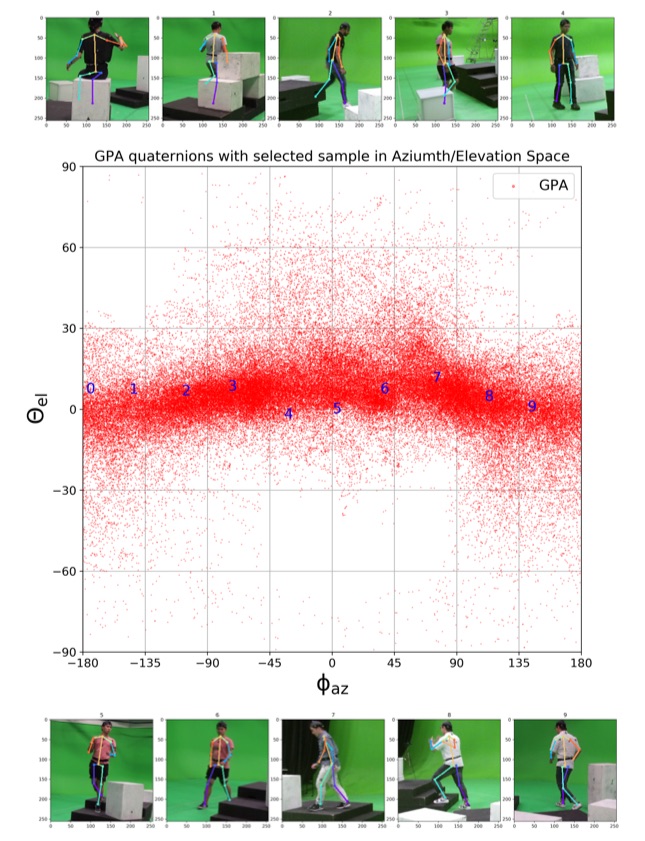
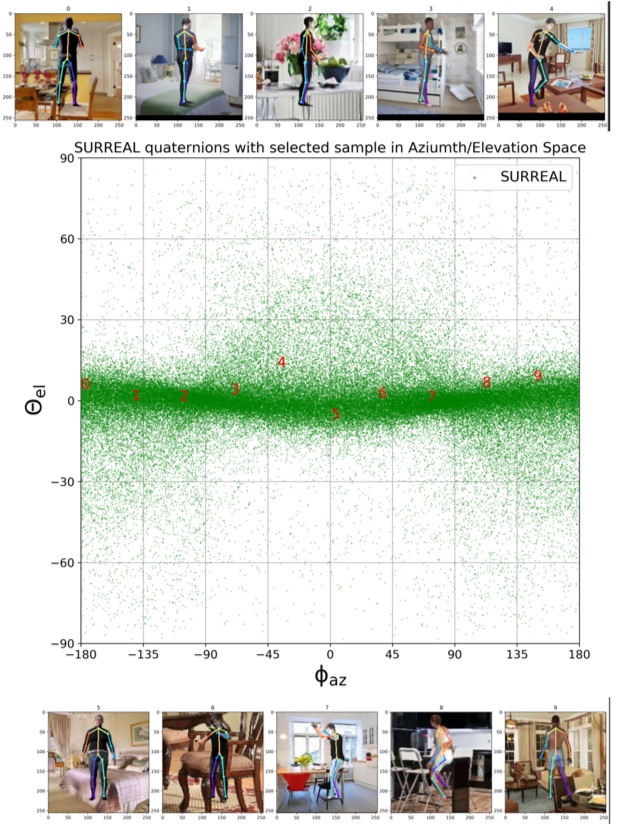
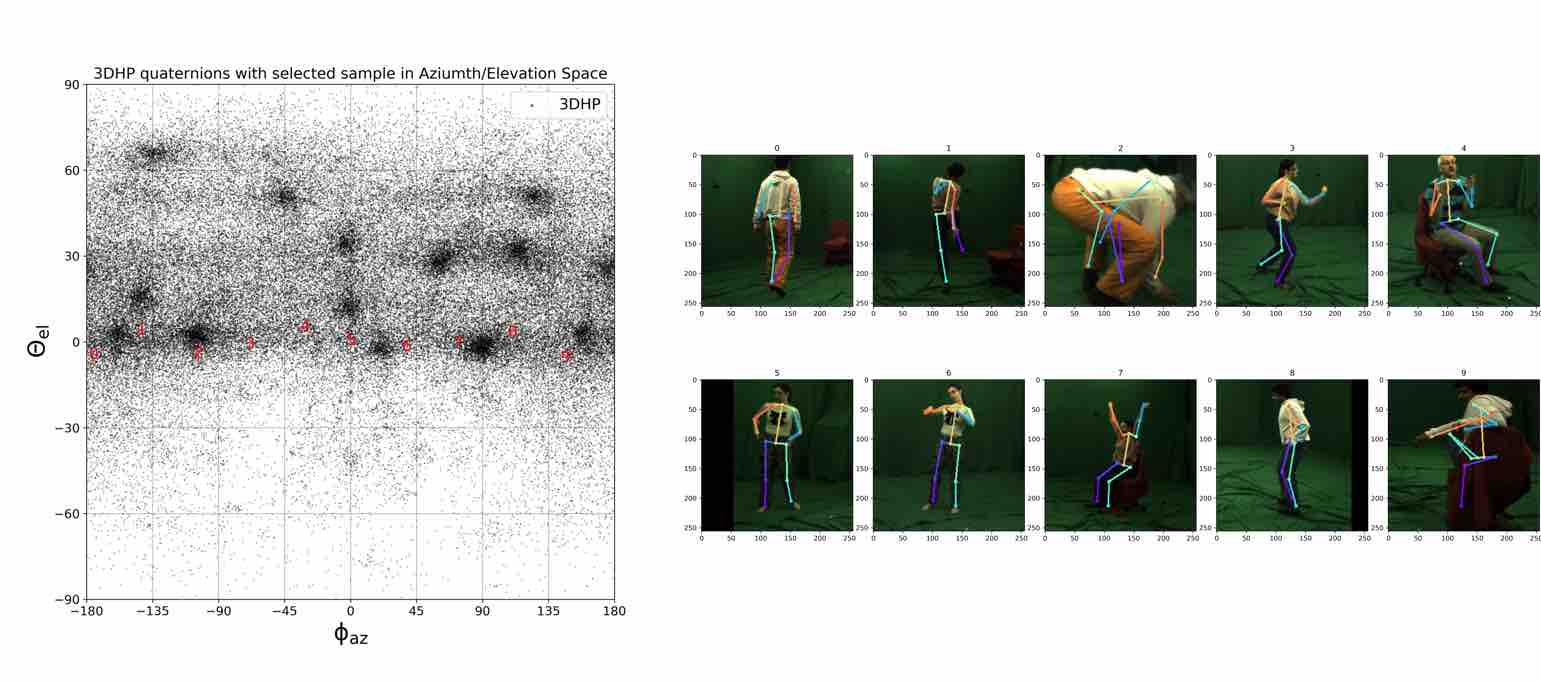
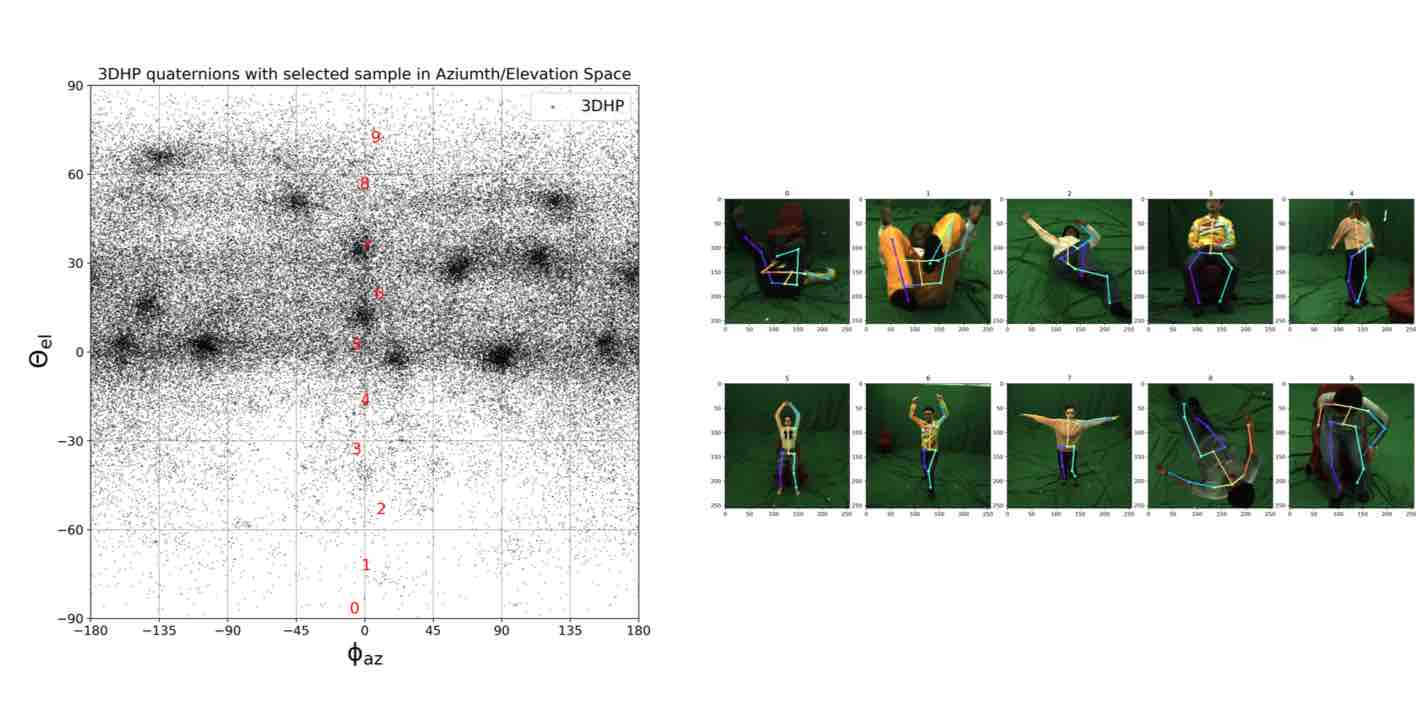
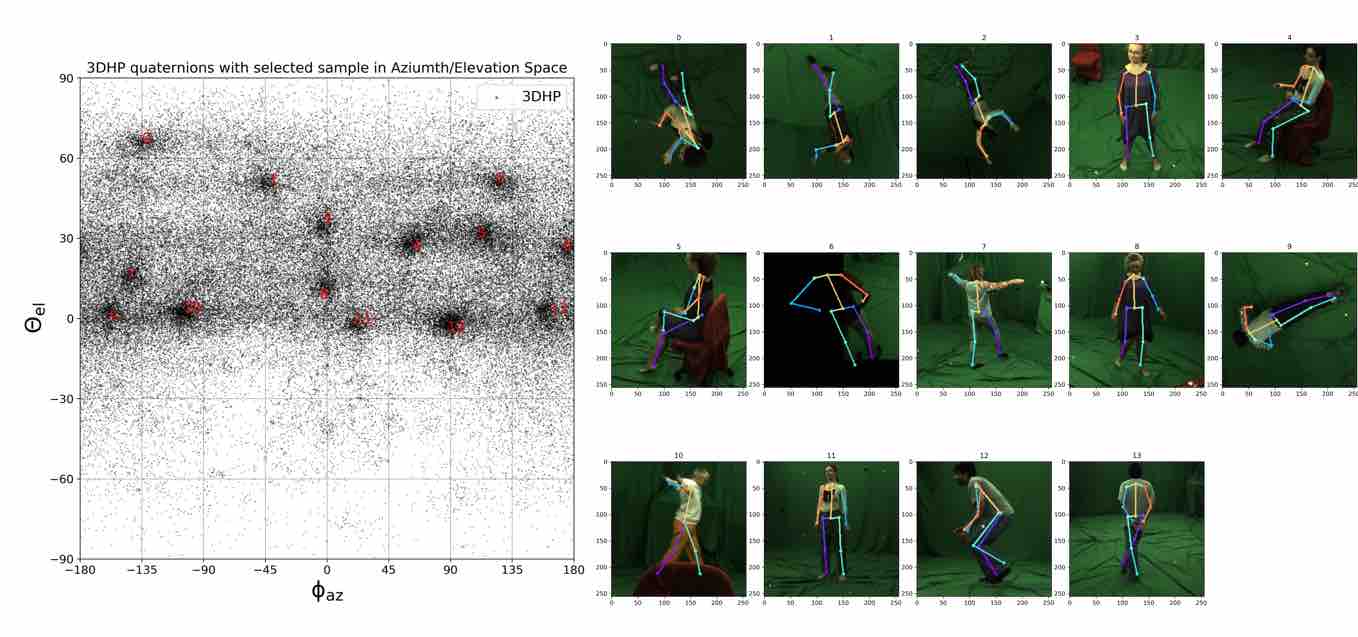
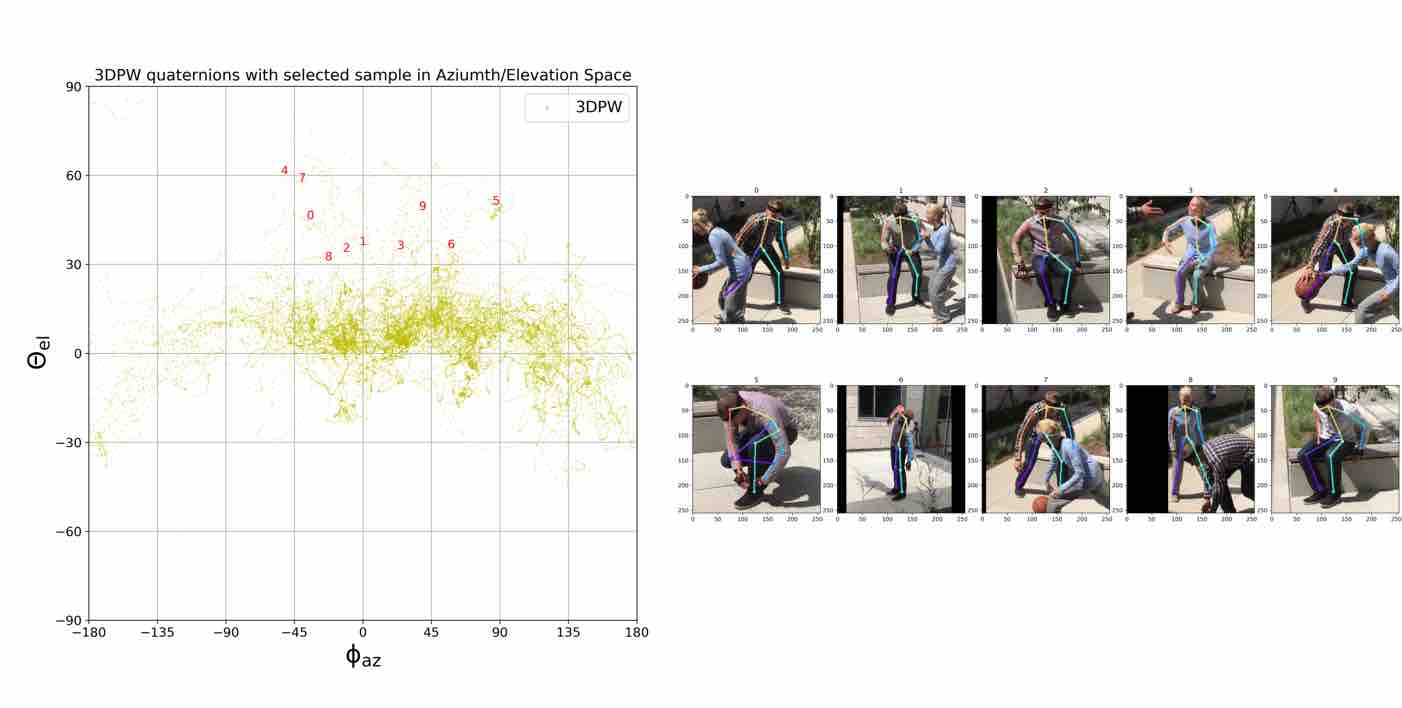
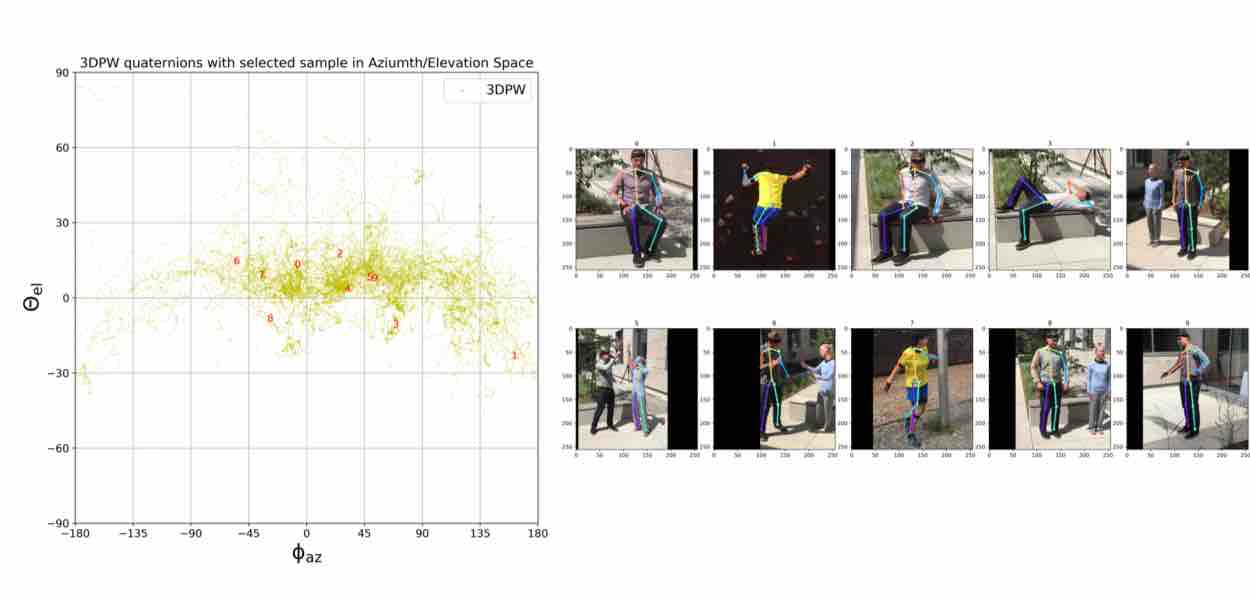
We visualize viewpoint distributions for train (3DHP) and test (H36M)
overlayed with the reduction in pose prediction error relative to baseline